Service Mesh & Networking Observability: Ingesting and Viewing Metrics

In Day 0 and Day 1 Ops, deployments are getting the workloads out into the wild are the most important piece to the puzzle. That is, until something goes wrong. Once a deployment fails, performance is degrading, or there's a security issue, engineers need a proper method to look at observability (logs, traces, and metrics).
In this blog post, you'll learn how to capture observability metrics within Kubernetes using Prometheus and Grafana, as well as via Gloo Mesh.
Cluster and Pod Network Observability
There are a lot of monitoring and observability tools ranging from what are called "enterprise" and "homegrown". Enterprise tools are the ones you usually pay for (Datadog, AppDynamics, New Relic, etc.). Homegrown solutions are usually freemium or open-source tools.
From a homegrown perspective, one of the best stacks for monitoring (viewing dashboards and alerting) and the metrics piece of observability is Kube-Prometheus. Kube-Prometheus is great because it gives you a ton of Kubernetes dashboards to use out of the most, a lot of which are for looking at the network health of both Pods and Clusters.
Let's start with Kube-Prometheus.
- Pull down the Kube-Prometheus Helm chart
helm repo add prometheus-community https://prometheus-community.github.io/helm-charts- Ensure that the Helm Chart is up to date, which it should be (this is just in case you already have it pulled down).
helm repo update- Install Kube-Prometheus within the
monitoringKubernetes Namespace.
helm install kube-prometheus -n monitoring prometheus-community/kube-prometheus-stack --create-namespaceNow that Kube-Prometheus is installed, you can access Grafana to view all of the dashboards.
- Run the following command to perform a port forwarding to your local host using the Grafana service so you can access the Grafana dashboard without having to set up a load balancer.
kubectl --namespace monitoring port-forward svc/kube-prometheus-grafana 3000:80- Once you're at the login screen, use the following credentials (if this is a production deployment, ensure you change the credentials below).
To log into Grafana:
1. Username: admin
2. Password: prom-operator
Once you get into the Grafana dashboard, go to Dashboards and you'll be able to see all of the Pod and Networking dashboards, all of which are pulling metrics from Prometheus, which is pulling metrics from your Kubernetes cluster via the /metrics endpoint.
kubectl get svc -n kube-system and see the metrics-server Kubernetes Service running.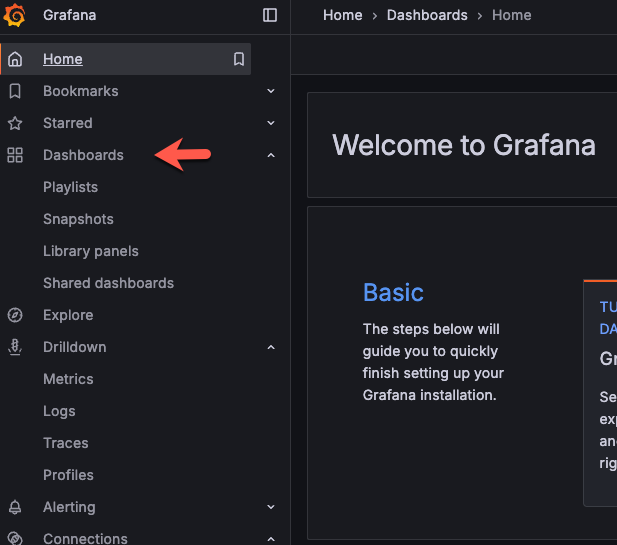
Next, we'll take a look at viewing Service Mesh metrics from the Prometheus server deployed via Gloo Mesh.
To avoid any conflicts between Kube-Prometheus and the Prometheus server that's already running, run the following command to uninstall the Kube-Prometheus Helm Chart.
helm uninstall kube-prometheus -n monitoringViewing Metrics From Gloo Mesh
In the previous section, you took a look at and installed Kube-Prometheus to get proper metric consumption for Pods and the cluster, but what about Kubernetes Services? Outside of the L3/L4 (the Pod network) layer, you'll want to think about L7 (the Service Mesh).
- To view the Prometheus implementation that comes by default with Goo Mesh Enterprise, run the following command:
kubectl get svc n gloo-meshYou'll see an output similar to the one below, which shows the prometheus-server running.
NAME                          TYPE           CLUSTER-IP     EXTERNAL-IP    PORT(S)                                                   AGE
gloo-mesh-mgmt-server         LoadBalancer   10.0.45.211    52.226.48.88   8090:32708/TCP,9900:32517/TCP                             13d
gloo-mesh-mgmt-server-admin   ClusterIP      10.0.45.241    <none>         9091/TCP                                                  13d
gloo-mesh-redis               ClusterIP      10.0.112.11    <none>         6379/TCP                                                  13d
gloo-mesh-ui                  ClusterIP      10.0.35.172    <none>         10101/TCP,8090/TCP,8081/TCP                               13d
gloo-telemetry-collector      ClusterIP      None           <none>         6831/UDP,14250/TCP,14268/TCP,4317/TCP,4318/TCP,9411/TCP   13d
gloo-telemetry-gateway        LoadBalancer   10.0.63.181    4.255.4.249    4317:31167/TCP                                            13d                                                  24h
prometheus-server ClusterIP 10.0.144.149 <none> 80/TCP- Next, you can access the Prometheus server via port forwarding.
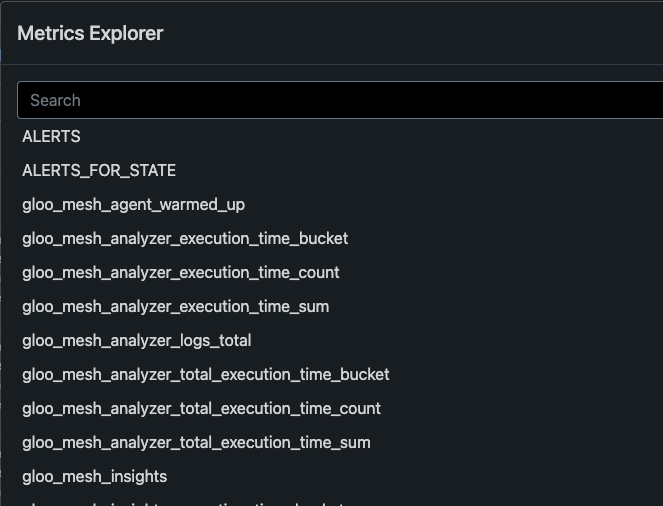
kubectl port-forward -n gloo-mesh svc/prometheus-server 8081:80Sidenote: It's good to take a look at the Prometheus server because within the Metrics explorer, you can see all of the metrics that are captured automatically for you.
For example, here are some of the Gloo Mesh metrics that are captured by default.
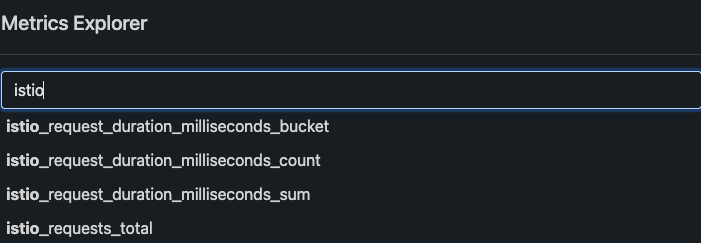
And here are some of the Istio metrics that are automatically captured for you.
- Next, you'll want to install Grafana so you can get a visual of the metrics that are captured via Prometheus. To do this, you can use Helm. Notice how there are some parameters set via the
--setflag (these are if you don't have avalues.yamlfile. These allow the data source to automatically capture the Prometheus server running.
helm install grafana-release grafana/grafana \
    --namespace monitoring \
    --create-namespace \
    --set 'datasources.datasources.yaml[0].name=Prometheus' \
    --set 'datasources.datasources.yaml[0].type=prometheus' \
    --set 'datasources.datasources.yaml[0].url=http://prometheus-server.gloo-mesh:80' \
    --set 'datasources.datasources.yaml[0].access=proxy' \
--set 'datasources.datasources.yaml[0].isDefault=true'- Once installed, you'll need to obtain the default Grafana password, which you can get by calling it from the Kubernetes Secret that gets automatically created via the Grafana installation.
kubectl get secret --namespace monitoring grafana-release -o jsonpath="{.data.admin-password}" | base64 --decode ; echo- To access the Grafana dashboard, perform a port-forward.
kubectl port-forward svc/grafana-release -n monitoring 3000:80Log in with the password you obtained from the Kubernetes Secret and the default admin username.
- Once you're in Grafana, go to the
exploretab on the left and you'll be able to start querying metrics.
http://prometheus-server.gloo-mesh:80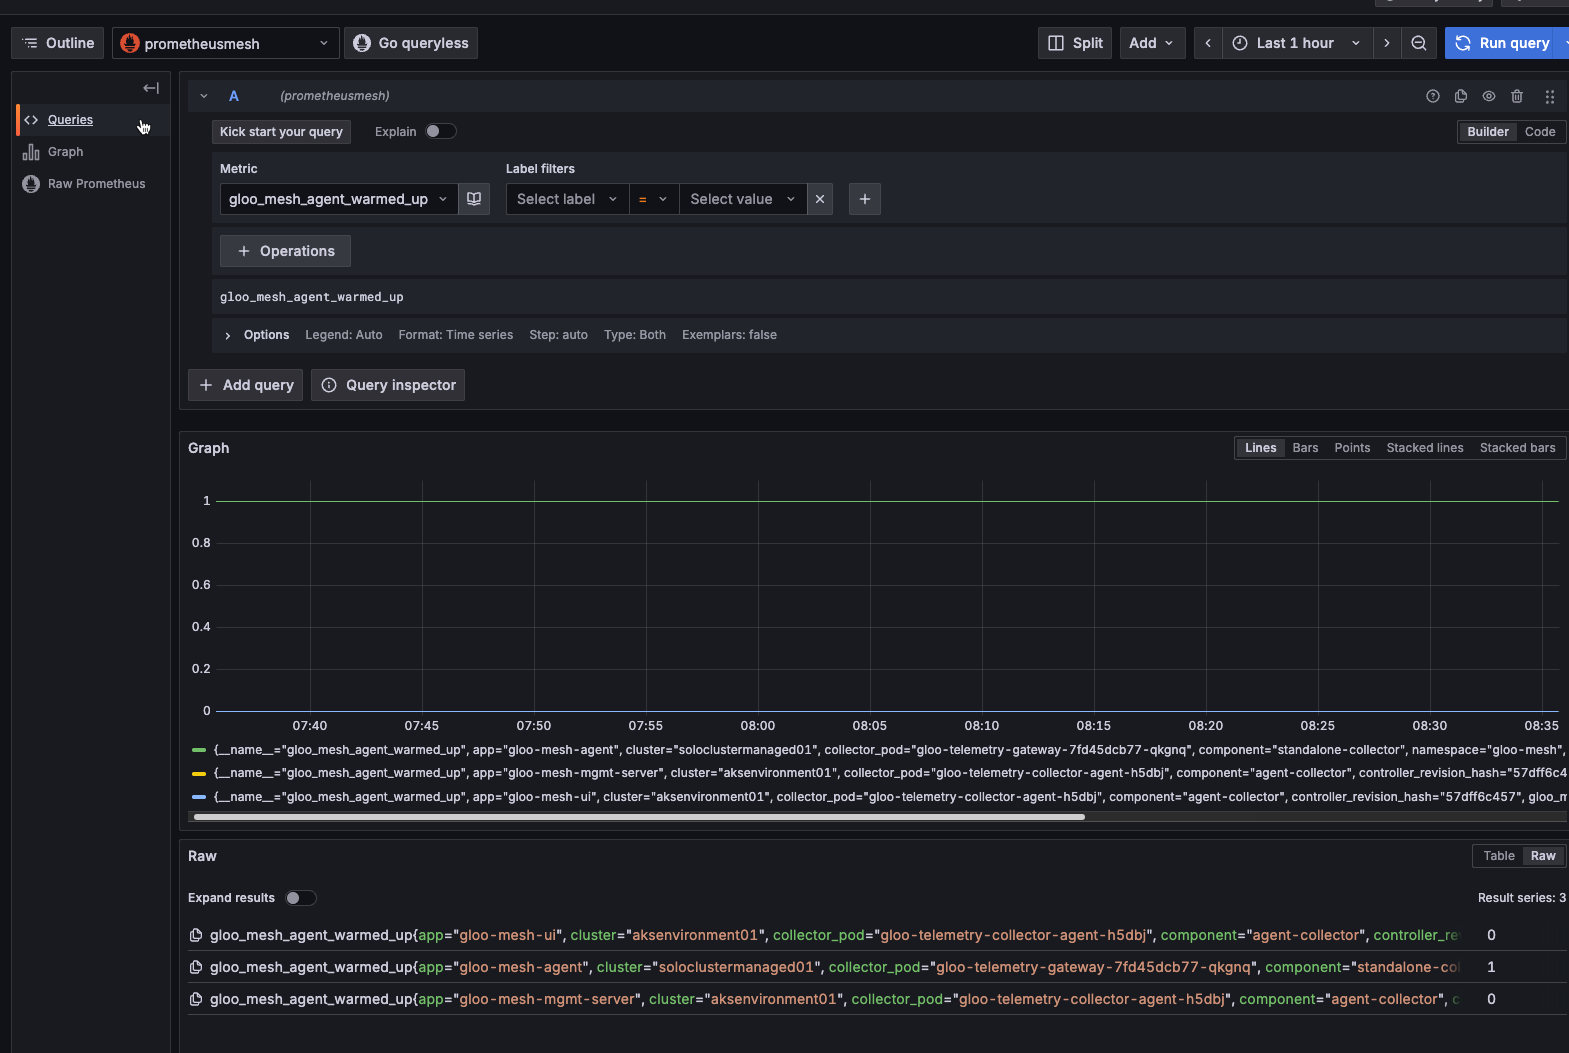
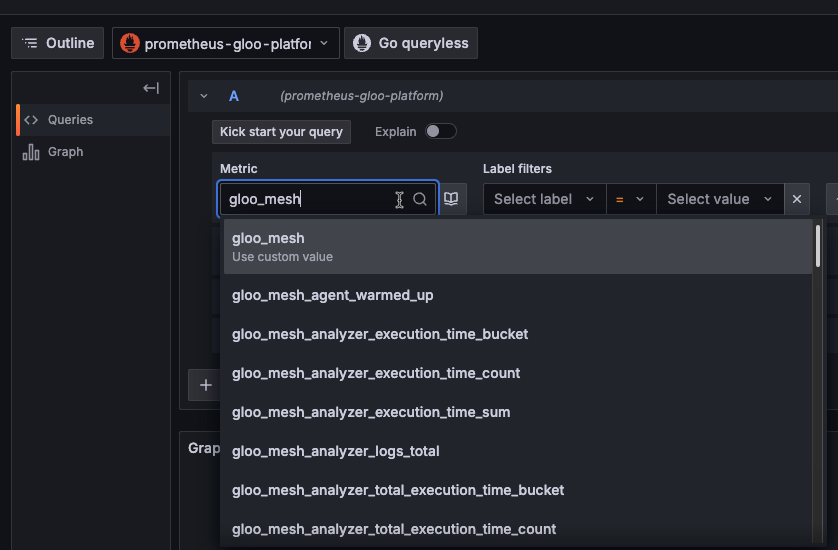
- Click the Metrics tab at on the left pane (right under the explore tab) and you'll be able to see all of the Metrics that are captured.
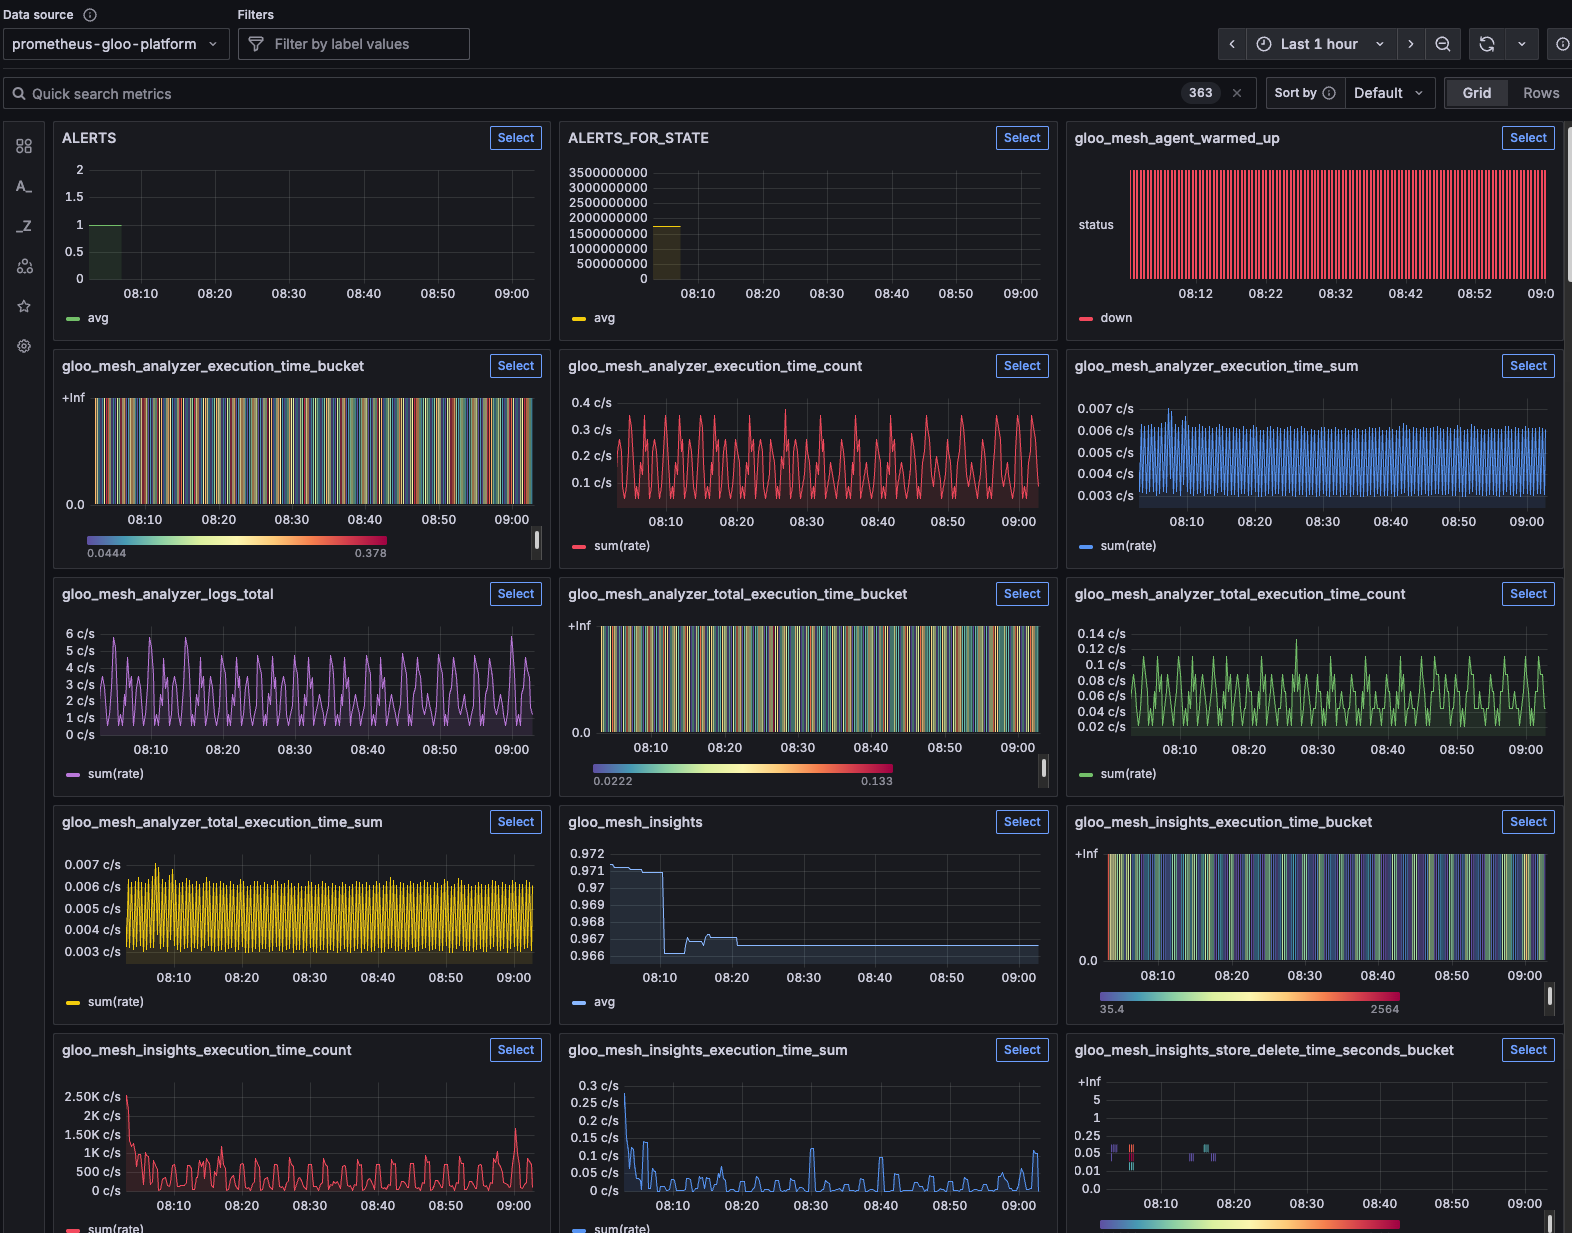
If you'd like, you can now start creating dashboards based on these metrics.
Conclusion
Within Kube-Prometheus or just Grafana and Prometheus, you have the ability to ensure metrics are observed at L3/L4 and L7 for clusters, Pods, and Kubernetes Services. With this implementation that only takes a few minutes, you'll have the ability to truly understand, from a networking perspective, what is occurring within your environment.

Comments ()