Tracing AI Traffic with OpenTelemetry and Agentgateway
The importance of setting up proper observability via tracing for end-to-end application health isn't out of the ordinary in any regard. The majority of Platform and DevOps teams have this level of observability for applications.
But what about Agentic traffic? Traffic going from an Agent to an LLM, another Agent, or an MCP Server. Because Agentic traffic is stateful (e.g - the context), understanding the end-to-end agentic traffic is crucial for knowing how your Agents are operating, performing, and managed.
In this blog post, you'll learn how to implement tracing in observability with traces that are exposed by default within agentgateway.
Setting Up Your Observability Stack
The first step is to ensure that you have a proper observability stack up and running. To follow suit with OSS tooling, you can use Grafana, Prometheus, and Tempo. Prometheus isn't necassarily needed for this as it's a metrics tool, not a tracing tool, but the kube-prometheus stack comes with it and the stack overall gives you great out-of-the-box dashboards.
Prometheus and Grafana
- Add the Prometheus Helm chart.
helm repo add prometheus-community https://prometheus-community.github.io/helm-charts
helm repo update- Install kube-prometheus.
helm upgrade --install kube-prometheus-stack prometheus-community/kube-prometheus-stack \
  --namespace monitoring \
  --create-namespace \
  --set prometheus.prometheusSpec.serviceMonitorSelectorNilUsesHelmValues=false \
  --set prometheus.prometheusSpec.podMonitorSelectorNilUsesHelmValues=false \
  --set prometheus.prometheusSpec.ruleSelectorNilUsesHelmValues=false \
  --set prometheus.prometheusSpec.retention=30d \
--set prometheus.prometheusSpec.storageSpec.volumeClaimTemplate.spec.resources.requests.storage=50Gi- Ensure that you can access both prometheus and grafana.
kubectl port-forward -n monitoring svc/kube-prometheus-stack-prometheus 9090:9090

kubectl port-forward -n monitoring svc/kube-prometheus-stack-grafana 3000:80- To log into Grafana, use the following:
Username: admin
Password: kubectl get secret kube-prometheus-stack-grafana -n monitoring -o jsonpath='{.data.admin-password}' | base64 --decode
Tempo and Prometheus
- Install Tempo with the default endpoint.
helm upgrade --install tempo tempo \
  --repo https://grafana.github.io/helm-charts \
  --namespace monitoring \
  --values - <<EOF
persistence:
  enabled: false
tempo:
  receivers:
    otlp:
      protocols:
        grpc:
          endpoint: 0.0.0.0:4317
EOF- Upgrade kube-prometheus with the Tempo configurations.
helm upgrade kube-prometheus-stack -n monitoring prometheus-community/kube-prometheus-stack \
  --reuse-values \
  --set 'grafana.additionalDataSources[0].name=Tempo' \
  --set 'grafana.additionalDataSources[0].type=tempo' \
  --set 'grafana.additionalDataSources[0].access=proxy' \
  --set 'grafana.additionalDataSources[0].url=http://tempo.monitoring.svc.cluster.local:3200' \
  --set 'grafana.additionalDataSources[0].uid=tempo'
Policy and OTel Collector Configurations
With kube-prometheus and tempo in place, you'll now need to set a reference grant, which allows the AgentgatewayPolicy (set up next) in agentgateway-system to reference the OTel collector service in monitoringalong with an OTel collector to ensure that the traces are being collected and sent to Grafana.
- Create the OTel collector which points to the proper receiver (the endpoint that was set in the previous section) along with pointing to the tempo k8s service.
helm upgrade --install opentelemetry-collector-traces opentelemetry-collector \
  --repo https://open-telemetry.github.io/opentelemetry-helm-charts \
  --version 0.127.2 \
  --set mode=deployment \
  --set image.repository="otel/opentelemetry-collector-contrib" \
  --set command.name="otelcol-contrib" \
  --namespace monitoring \
  -f -<<EOF
config:
  receivers:
    otlp:
      protocols:
        grpc:
          endpoint: 0.0.0.0:4317
        http:
          endpoint: 0.0.0.0:4318
  exporters:
    otlp/tempo:
      endpoint: http://tempo.monitoring.svc.cluster.local:4317
      tls:
        insecure: true
    debug:
      verbosity: detailed
  service:
    pipelines:
      traces:
        receivers: [otlp]
        processors: [batch]
        exporters: [debug, otlp/tempo]
EOF- Create the reference grant.
kubectl apply -f - <<EOF
apiVersion: gateway.networking.k8s.io/v1beta1
kind: ReferenceGrant
metadata:
  name: allow-otel-collector-traces-access
  namespace: monitoring
spec:
  from:
  - group: agentgateway.dev
    kind: AgentgatewayPolicy
    namespace: agentgateway-system
  to:
  - group: ""
    kind: Service
    name: opentelemetry-collector-traces
EOF- Implement an agentgateway policy that targets the gateway as the target reference and configures distributed tracing for agentgateway. It enables observability into requests flowing through the gateway (e.g - when requests come int the gateway, tracing records what happened during the request).
kubectl apply -f - <<EOF
apiVersion: agentgateway.dev/v1alpha1
kind: AgentgatewayPolicy
metadata:
  name: tracing-policy
  namespace: agentgateway-system
spec:
  targetRefs:
  - group: gateway.networking.k8s.io
    kind: Gateway
    name: agentgateway-route
  frontend:
    tracing:
      backendRef:
        name: opentelemetry-collector-traces
        namespace: monitoring
        port: 4317
      protocol: GRPC
      clientSampling: "true"
      randomSampling: "true"
      resources:
        - name: deployment.environment
          expression: '"development"'
        - name: service.name
          expression: '"agentgateway"'
      attributes:
        add:
        - name: request.host
          expression: 'request.host'
EOF
Verification
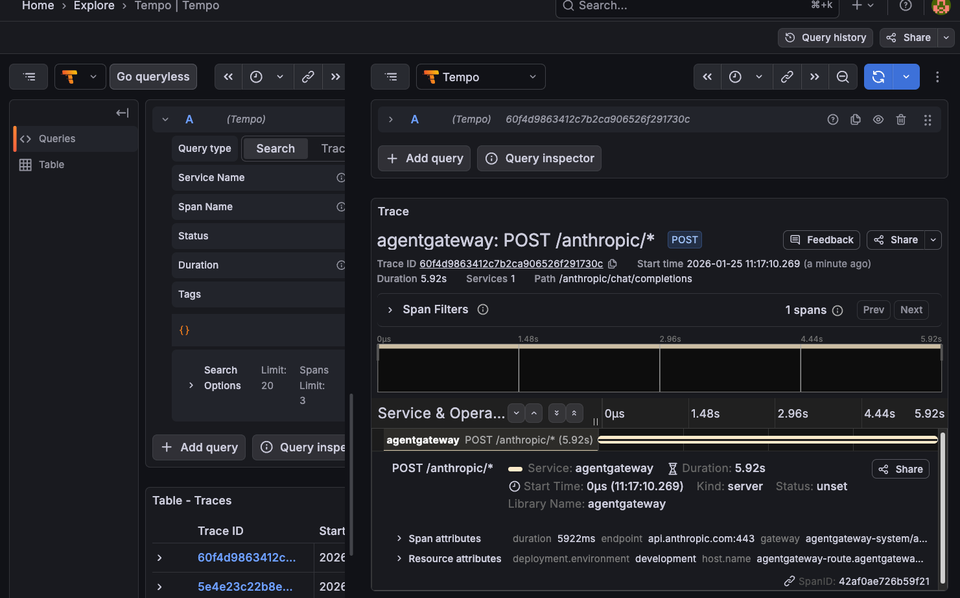
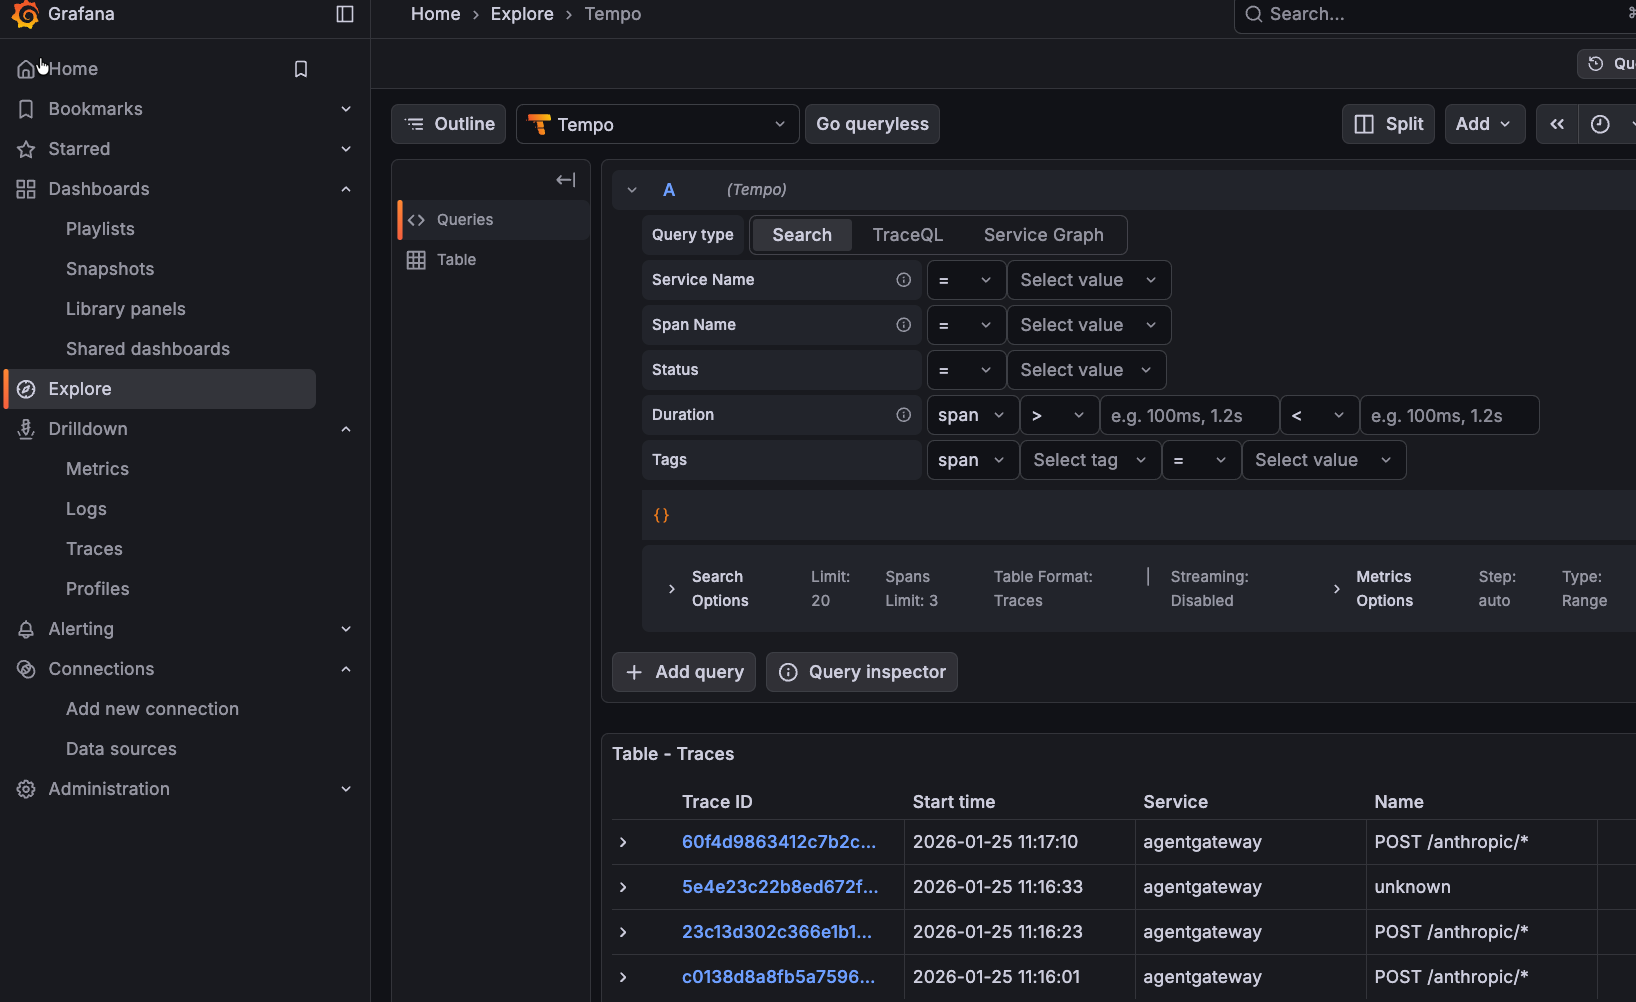
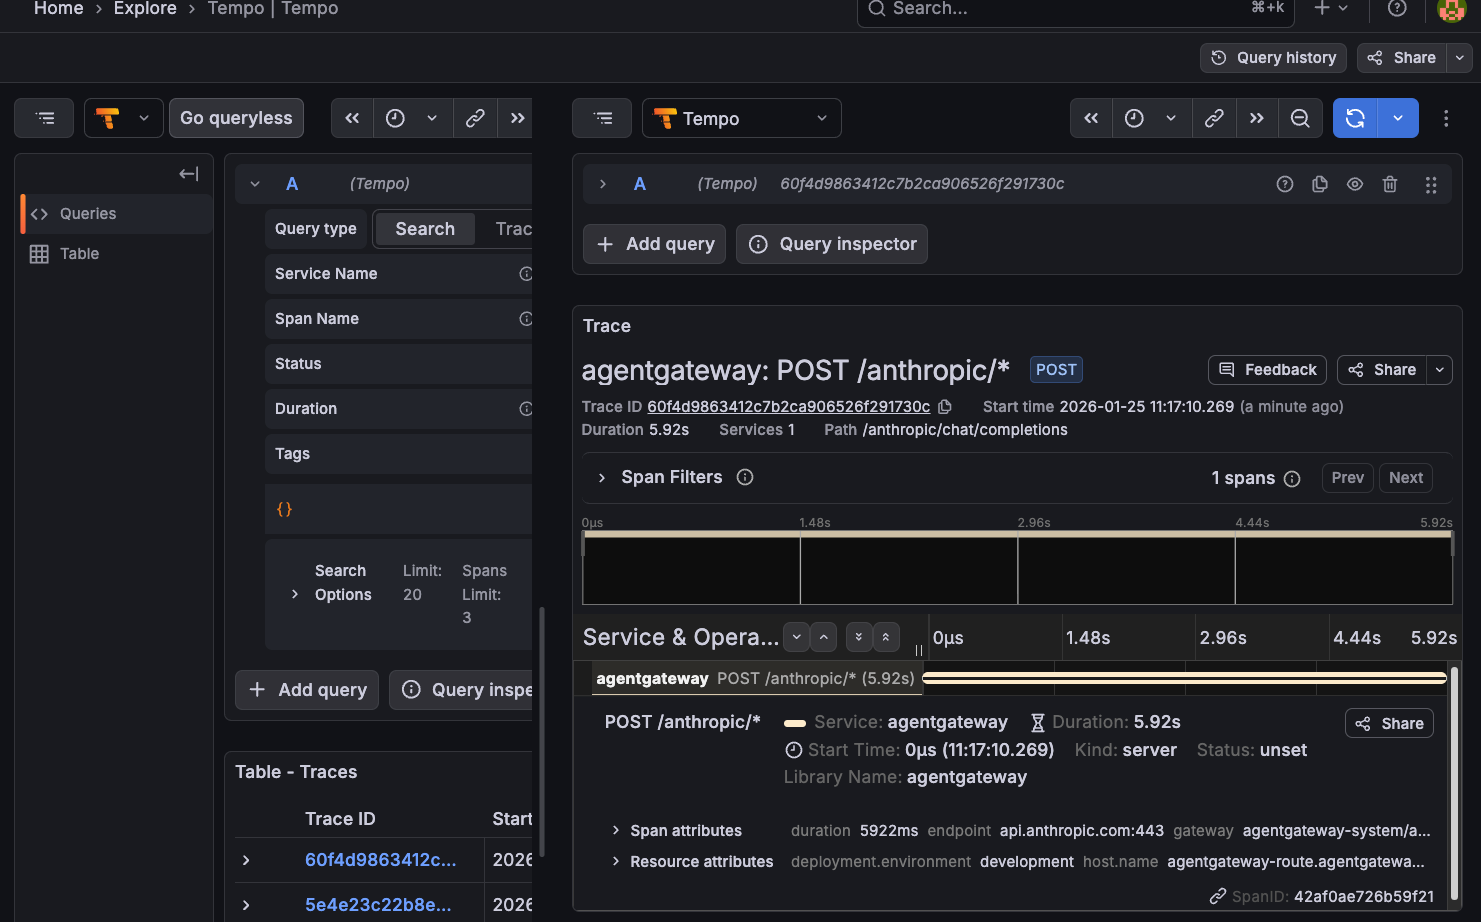
With everything up and running, we can ensure that the information is being collected as expected within Grafana.
- Open the Grafana UI.
- Navigate to Explore -> Tempo datasource.
- Search for traces by service name agentgateway.
You should see output similar to the following:

Comments ()