Debugging Ztunnel In Istio Ambient Mesh
Day 0 Ops suggests we architect a solution, Day 1 is implementation, and Day 2 is management. When debugging networks after they've been successfully implemented, it's time to start debugging when things inevitably go wrong.
In this blog post, you'll learn about a few key ways to debug Ztunnel and what Ztunnel is.
Prerequisites
To follow along with this blog post, you will need:
- Istioctl installed.
- Istio installed. You can follow this blog post to get Istio up and running in your Kubernetes cluster.
What Is Ztunnel
Before Istio Ambient Mesh, there were sidecars for Istio. Sidecars are containers that act as, as the name suggests, sidecar containers that live inside of the Pod where your application exists. The goal with a sidecar was to have the ability to perform L4 and L7 routing/security/observability capabilities for your application.
With Ambient Mesh, sidecars go away. Now, L4 and L7 are split into it's own capabilities. L7 handles all of the application routing like HTTP Routes, API Gateways, and policies. L4 handles the secure communication (think mTLS) between clusters and services (east/west traffic).
The L4 layer is handled by Ztunnel.
Troubleshooting Ztunnel
There are a few key ways to troubleshoot Ztunnel. Some, you may already be familiar with (like looking at Pod logs) and others you may not have seen yet (using istioctl to look at configs).
In this section, you'll learn about:
- Retrieving Ztunnel configs
- Kubectl Pod logs for Ztunnel
- Ztunnel workloads
- Confirming socket state
The ZC Command
With istioctl, you'll see a command called ztunnel-config, but you can use zc for short if you'd like.
If you run istioctl zc, you'll see the following output.
A group of commands used to update or retrieve Ztunnel configuration from a Ztunnel instance.

Usage:
  istioctl ztunnel-config [command]

Aliases:
  ztunnel-config, zc

Examples:
  # Retrieve summary about workload configuration
  istioctl ztunnel-config workload

  # Retrieve summary about certificates
  istioctl ztunnel-config certificates

Available Commands:
  all         Retrieves all configuration for the specified Ztunnel pod.
  certificate Retrieves certificate for the specified Ztunnel pod.
  connections Retrieves connections for the specified Ztunnel pod.
  log         Retrieves logging levels of the Ztunnel instance in the specified pod.
  policy      Retrieves policies for the specified Ztunnel pod.
  service     Retrieves services for the specified Ztunnel pod.
  workload    Retrieves workload configuration for the specified Ztunnel pod.
As you can see, there are several commands from looking at certifications to services that are specified within Ztunnel.
Sidenote: To ensure that you have Ztunnel set up for your apps, you need to label the Namespace where your application stack exists with: kubectl label namespace YOUR_NAMESPACE istio.io/dataplane-mode=ambient
When you apply the Label above to a Namespace, Ztunnel will automatically intercept and secure all L4 traffic to and from your application stack (workloads) within the Namespace that you specified with mTLS. You do not need to restart any Pods/Deployments for this to take effect.
Retrieving Configs
Run the following command to see all Services that are onboarded to Ztunnel.
istioctl zc serviceFor example, if you label a Namespace called microapp and there are workloads running there, here's an example output:
NAMESPACE    SERVICE NAME              SERVICE VIP    WAYPOINT ENDPOINTS
default      kubernetes                10.100.0.1     None     2/2
istio-system istiod                    10.100.157.217 None     1/1
kube-system  eks-extension-metrics-api 10.100.177.213 None     1/1
kube-system  kube-dns                  10.100.0.10    None     2/2
microapp     adservice                 10.100.40.147  None     1/1
microapp     cartservice               10.100.55.105  None     1/1
microapp     checkoutservice           10.100.172.22  None     1/1
microapp     currencyservice           10.100.132.105 None     1/1
microapp     emailservice              10.100.146.50  None     1/1
microapp     frontend                  10.100.228.98  None     1/1
microapp     frontend-external         10.100.138.27  None     1/1
microapp     paymentservice            10.100.214.104 None     1/1
microapp     productcatalogservice     10.100.234.101 None     1/1
microapp     recommendationservice     10.100.85.77   None     1/1
microapp     redis-cart                10.100.104.99  None     1/1
microapp shippingservice 10.100.51.207 None 1/1Using the all flag via zc you can see everything from what specific nodes a Ztunnel Pod is running on to what Services/Pods your application stack is running on to certificate information.
istioctl ztunnel-config all -o jsonLogging
The next step in troubleshooting is looking at logs, specifically from Pods.
When using Ztunnel, it's set up as a DaemonSet, which means there are going to be as many Ztunnel Pods as there are Worker Nodes.
Take a look at the Ztunnel Pods within the istio-system Namespace and run the following command:
istioctl zc log POD_NAME -n istio-systemYou can also take a look at all of the Ztunnel Pods by looking at the logs for the DaemonSet.
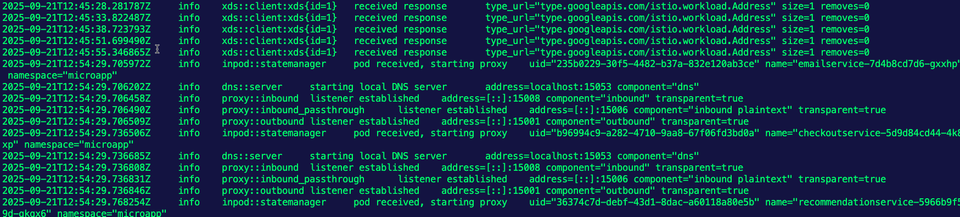
kubectl logs ds/ztunnel -n istio-systemHere's some example output after running the above:
2025-09-21T12:45:33.822487Z     info    xds::client:xds{id=1}   received response       type_url="type.googleapis.com/istio.workload.Address" size=1 removes=0
2025-09-21T12:45:38.723793Z     info    xds::client:xds{id=1}   received response       type_url="type.googleapis.com/istio.workload.Address" size=1 removes=0
2025-09-21T12:45:51.699490Z     info    xds::client:xds{id=1}   received response       type_url="type.googleapis.com/istio.workload.Address" size=1 removes=0
2025-09-21T12:45:55.346865Z     info    xds::client:xds{id=1}   received response       type_url="type.googleapis.com/istio.workload.Address" size=1 removes=0
2025-09-21T12:54:29.705972Z     info    inpod::statemanager     pod received, starting proxy    uid="235b0229-30f5-4482-b37a-832e120ab3ce" name="emailservice-7d4b8cd7d6-gxxhp" namespace="microapp"
2025-09-21T12:54:29.706202Z     info    dns::server     starting local DNS server       address=localhost:15053 component="dns"
2025-09-21T12:54:29.706458Z     info    proxy::inbound  listener established    address=[::]:15008 component="inbound" transparent=true
2025-09-21T12:54:29.706490Z     info    proxy::inbound_passthrough      listener established    address=[::]:15006 component="inbound plaintext" transparent=true
2025-09-21T12:54:29.706509Z     info    proxy::outbound listener established    address=[::]:15001 component="outbound" transparent=true
2025-09-21T12:54:29.736506Z     info    inpod::statemanager     pod received, starting proxy    uid="b96994c9-a282-4710-9aa8-67f06fd3bd0a" name="checkoutservice-5d9d84cd44-4k8
Notice how you can see everything from inbound traffic to xDS configurations.
Last but certainly not least, when looking at Ztunnel logs, you should always take a look at Istiod logs to see if perhaps something is happening at the Control Plane level.
kubectl logs ISTIOD_POD -n istio-systemWorkloads
You already saw this when using the istioctl zc all command, but if you want to specifically look at workloads, you can use the workloads command.
istioctl zc workloadsThis will output:
- Namespaces where Ztunnel is collecting information from.
- Pods and Services that are onboarded to Ztunnel.
- The IP addresses and nodes where the Pods/services exist.
- The protocol that the Pod/Service is using.
Socket State
The last step is to confirm the socket state. The goal is to confirm that the HBONE ports are open (15001, 15006, 15008). Ztunnel relies on the HBONE protocol to ensure secure and encrypted tunnels for L4 traffic in Istio Ambient Mesh.
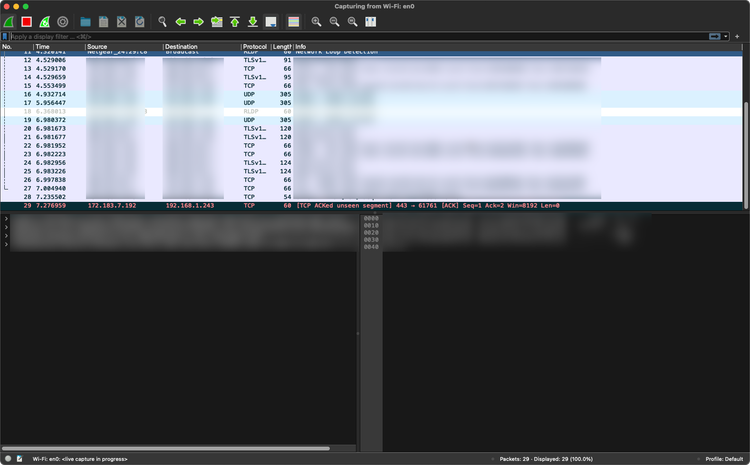
You can test this out by using Netshoot, a popular functional test suite for testing Kubernetes and Docker network traffic.
kubectl debug $(kubectl get pod -l app=frontend -n microapp -o jsonpath='{.items[0].metadata.name}') -it -n microapp --image nicolaka/netshoot -- ss -ntlpConclusion
The majority of traffic that you'll see within a Service Mesh environment is at the L4 layer unless you need more advanced-level routing. Because of that, understanding how to troubleshoot at the L4 layer is crucial to ensure your environment is running as expected. To troubleshoot in the world of L4 for Istio Ambient Mesh, you need to look underneath the hood of Ztunnel.

Comments ()