FinOps For Agentic: How To Capture Token Usage Cost Across LLMs
There's one major topic that every organization is talking about right now when it comes to Agentic workloads:
- How am I going to track cost?
Tracking cost comes down to Agentic traffic, LLM traffic, and overall Token usage. The problem is that right now, it's scattered. Everyone is using an Agent and that Agent is tied to an API key, not a Gateway or a user. There's no way to track the cost.
Until now.
In this blog post, you'll learn how to track all AI/LLM/Token usage/cost across all Gateways at once with agentgateway.
Prerequisites
To follow along with this blog post from a hands-on perspective, you'll want to have the following:
- A Kubernetes cluster
- An Anthropic API key
If you don't have these readily available, you can follow along from a theoretical perspective. If you have another AI provider like OpenAI and not Anthropic, you can swap out the Model/LLM calls in the Backend object for whichever Model you want to use.
Gateway Installation
In this section, you will use two open-source tools - kgateway as the control plane and agentgateway as the data plane/proxy.
- Install the Kubernetes Gateway API CRDs.
kubectl apply -f https://github.com/kubernetes-sigs/gateway-api/releases/download/v1.4.0/standard-install.yaml- Install the CRDs for kgateway.
helm upgrade -i --create-namespace --namespace kgateway-system --version v2.2.0-main \
kgateway-crds oci://cr.kgateway.dev/kgateway-dev/charts/kgateway-crds \
--set controller.image.pullPolicy=Always- Install kgateway with agentgateway enabled.
helm upgrade -i --namespace kgateway-system --version v2.2.0-main kgateway oci://cr.kgateway.dev/kgateway-dev/charts/kgateway \
  --set gateway.aiExtension.enabled=true \
  --set agentgateway.enabled=true  \
--set controller.image.pullPolicy=Always- Confirm that the kgateway control plane is operational.
kubectl get pods -n kgateway-systemGrafana Configuration
For the purposes of this blog post, you'll use the kube-prometheus Stack to set up metric collection and showcase those metrics via a dashboard within Grafana to see the AI/LLM/Token usage/cost. To accomplish that, you'll install kube-prometheus and configure ServiceMonitors/PrometheusRules
Install Kube-Prometheus
- Install kube-prometheus.
helm repo add prometheus-community https://prometheus-community.github.io/helm-charts
helm repo update

helm upgrade --install kube-prometheus-stack prometheus-community/kube-prometheus-stack \
  --namespace monitoring \
  --create-namespace \
  --set prometheus.prometheusSpec.serviceMonitorSelectorNilUsesHelmValues=false \
  --set prometheus.prometheusSpec.podMonitorSelectorNilUsesHelmValues=false \
  --set prometheus.prometheusSpec.ruleSelectorNilUsesHelmValues=false \
  --set prometheus.prometheusSpec.retention=30d \
--set prometheus.prometheusSpec.storageSpec.volumeClaimTemplate.spec.resources.requests.storage=50Gi- Access the Grafana dashboard.
kubectl port-forward -n monitoring svc/kube-prometheus-stack-grafana 3000:80Username: admin
Password retrieval: kubectl get secret -n monitoring kube-prometheus-stack-grafana -o jsonpath='{.data.admin-password}' | base64 -d && echo
Configure Monitors
- Go to this repo, copy the
monitoring.yamlconfig, save it, and apply it.
kubectl apply -f monitoring.yamlConfigure The Dashboard
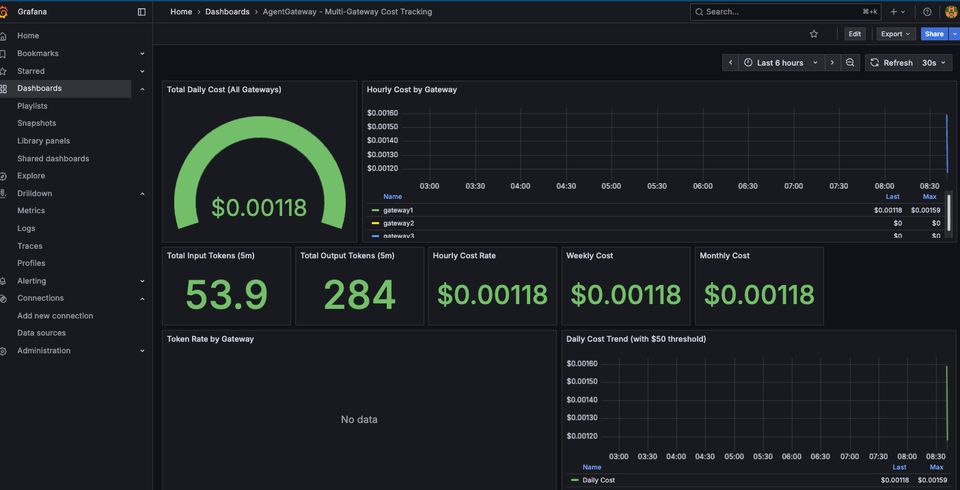
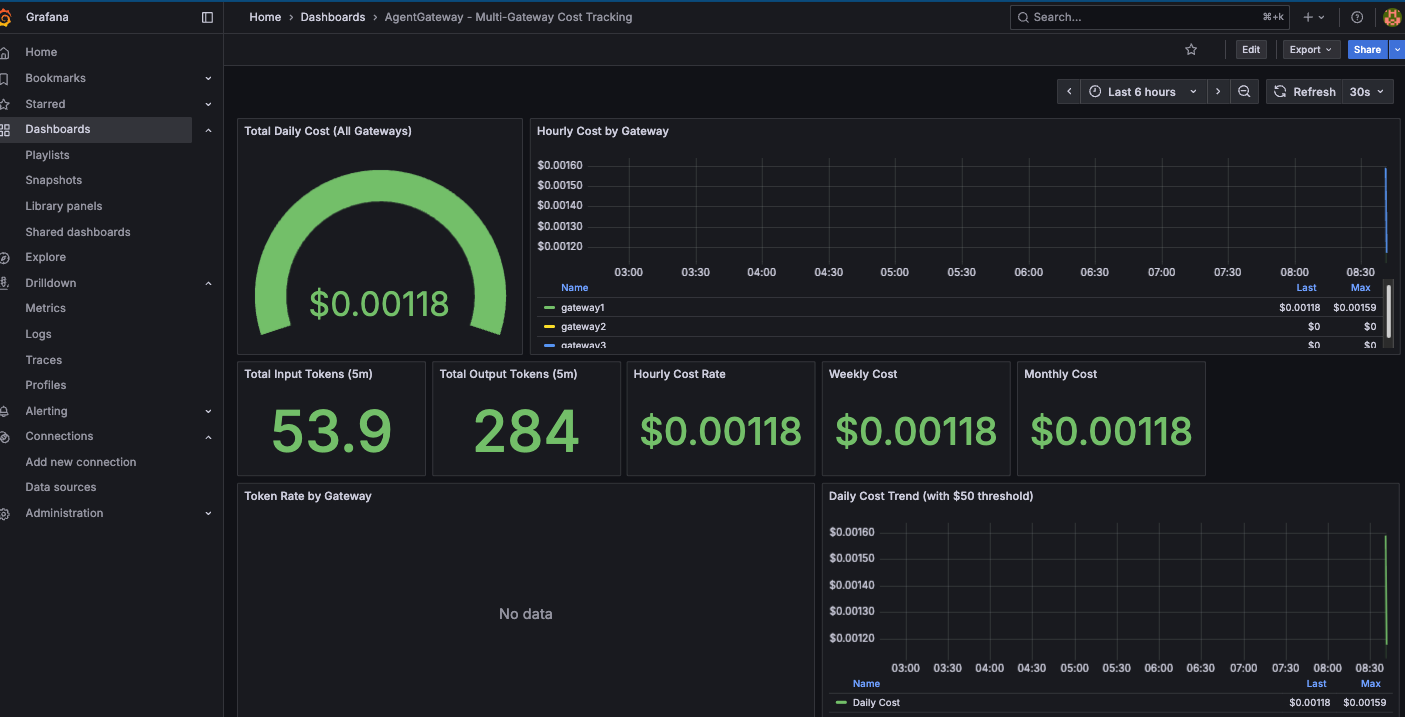
The last step is to configure a proper dashboard so you can see all of the Token/LLM/AI costs via the Gateways.
- Open Grafana
- Go to Dashboards > Import
- Upload
grafana-dashboard.jsonor paste its contents. You can find the dashboard here. - Select "Prometheus" as the data source and click Import
Create Gateways
Now that kgateway is installed, you can create Gateways with backends to LLMs. In this section, you'll create 3 very similar Gateways. The reason you'll create 3 is to showcase how you can collect LLM/AI/Token costs across multiple Gateways at once instead of having to collect the cost for each Gateway one at a time, which saves engineering/FinOps cycles.
Configure Gateways
- Set your Anthropic API key as an environment variable.
export ANTHROPIC_API_KEY=- Create a Secret for your API key.
kubectl apply -f- <<EOF
apiVersion: v1
kind: Secret
metadata:
  name: anthropic-secret
  namespace: kgateway-system
  labels:
    app: agentgateway
type: Opaque
stringData:
  Authorization: $ANTHROPIC_API_KEY
EOF- Create Gateway/Route/Backend number 1.
kubectl apply -f- <<EOF
kind: Gateway
apiVersion: gateway.networking.k8s.io/v1
metadata:
  name: agentgateway1
  namespace: kgateway-system
  labels:
    app: agentgateway1
spec:
  gatewayClassName: agentgateway
  listeners:
  - protocol: HTTP
    port: 8080
    name: http
    allowedRoutes:
      namespaces:
        from: All
---
apiVersion: gateway.kgateway.dev/v1alpha1
kind: Backend
metadata:
  labels:
    app: agentgateway1
  name: anthropic1
  namespace: kgateway-system
spec:
  type: AI
  ai:
    llm:
        anthropic:
          authToken:
            kind: SecretRef
            secretRef:
              name: anthropic-secret
          model: "claude-3-5-haiku-latest"
---
apiVersion: gateway.networking.k8s.io/v1
kind: HTTPRoute
metadata:
  name: claude1
  namespace: kgateway-system
  labels:
    app: agentgateway1
spec:
  parentRefs:
    - name: agentgateway1
      namespace: kgateway-system
  rules:
  - matches:
    - path:
        type: PathPrefix
        value: /anthropic
    filters:
    - type: URLRewrite
      urlRewrite:
        path:
          type: ReplaceFullPath
          replaceFullPath: /v1/chat/completions
    backendRefs:
    - name: anthropic1
      namespace: kgateway-system
      group: gateway.kgateway.dev
      kind: Backend
EOF- Number 2.
kubectl apply -f- <<EOF
kind: Gateway
apiVersion: gateway.networking.k8s.io/v1
metadata:
  name: agentgateway2
  namespace: kgateway-system
  labels:
    app: agentgateway2
spec:
  gatewayClassName: agentgateway
  listeners:
  - protocol: HTTP
    port: 8080
    name: http
    allowedRoutes:
      namespaces:
        from: All
---
apiVersion: gateway.kgateway.dev/v1alpha1
kind: Backend
metadata:
  labels:
    app: agentgateway2
  name: anthropic2
  namespace: kgateway-system
spec:
  type: AI
  ai:
    llm:
        anthropic:
          authToken:
            kind: SecretRef
            secretRef:
              name: anthropic-secret
          model: "claude-3-5-haiku-latest"
---
apiVersion: gateway.networking.k8s.io/v1
kind: HTTPRoute
metadata:
  name: claude2
  namespace: kgateway-system
  labels:
    app: agentgateway2
spec:
  parentRefs:
    - name: agentgateway2
      namespace: kgateway-system
  rules:
  - matches:
    - path:
        type: PathPrefix
        value: /anthropic
    filters:
    - type: URLRewrite
      urlRewrite:
        path:
          type: ReplaceFullPath
          replaceFullPath: /v1/chat/completions
    backendRefs:
    - name: anthropic2
      namespace: kgateway-system
      group: gateway.kgateway.dev
      kind: Backend
EOF- Number 3.
kubectl apply -f- <<EOF
kind: Gateway
apiVersion: gateway.networking.k8s.io/v1
metadata:
  name: agentgateway3
  namespace: kgateway-system
  labels:
    app: agentgateway3
spec:
  gatewayClassName: agentgateway
  listeners:
  - protocol: HTTP
    port: 8080
    name: http
    allowedRoutes:
      namespaces:
        from: All
---
apiVersion: gateway.kgateway.dev/v1alpha1
kind: Backend
metadata:
  labels:
    app: agentgateway3
  name: anthropic3
  namespace: kgateway-system
spec:
  type: AI
  ai:
    llm:
        anthropic:
          authToken:
            kind: SecretRef
            secretRef:
              name: anthropic-secret
          model: "claude-3-5-haiku-latest"
---
apiVersion: gateway.networking.k8s.io/v1
kind: HTTPRoute
metadata:
  name: claude3
  namespace: kgateway-system
  labels:
    app: agentgateway3
spec:
  parentRefs:
    - name: agentgateway3
      namespace: kgateway-system
  rules:
  - matches:
    - path:
        type: PathPrefix
        value: /anthropic
    filters:
    - type: URLRewrite
      urlRewrite:
        path:
          type: ReplaceFullPath
          replaceFullPath: /v1/chat/completions
    backendRefs:
    - name: anthropic3
      namespace: kgateway-system
      group: gateway.kgateway.dev
      kind: Backend
EOF
Test Gateways
- Add the load balancer IP into an environment variable for each Gateway.
export INGRESS_GW_ADDRESSONE=$(kubectl get svc -n kgateway-system agentgateway1 -o jsonpath="{.status.loadBalancer.ingress[0]['hostname','ip']}")
echo $INGRESS_GW_ADDRESSONE

export INGRESS_GW_ADDRESSTWO=$(kubectl get svc -n kgateway-system agentgateway2 -o jsonpath="{.status.loadBalancer.ingress[0]['hostname','ip']}")
echo $INGRESS_GW_ADDRESSTWO

export INGRESS_GW_ADDRESSTHREE=$(kubectl get svc -n kgateway-system agentgateway3 -o jsonpath="{.status.loadBalancer.ingress[0]['hostname','ip']}")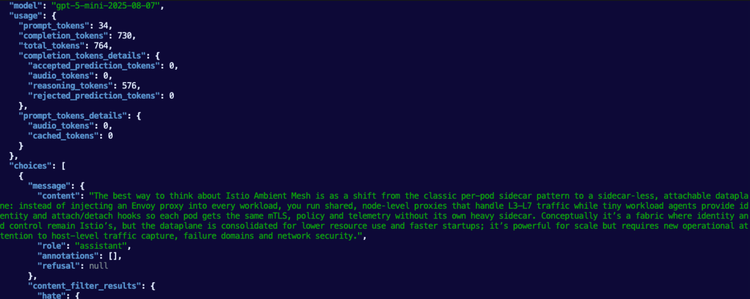
echo $INGRESS_GW_ADDRESSTHREE- Test each Gateway.
curl "$INGRESS_GW_ADDRESSONE:8080/anthropic" -v \ -H content-type:application/json -H x-api-key:$ANTHROPIC_API_KEY -H "anthropic-version: 2023-06-01" -d '{
  "model": "claude-sonnet-4-5",
  "messages": [
    {
      "role": "system",
      "content": "You are a skilled cloud-native network engineer."
    },
    {
      "role": "user",
      "content": "Write me a paragraph containing the best way to think about Istio Ambient Mesh"
    }
  ]
}' | jq
curl "$INGRESS_GW_ADDRESSTWO:8080/anthropic" -v \ -H content-type:application/json -H x-api-key:$ANTHROPIC_API_KEY -H "anthropic-version: 2023-06-01" -d '{
"model": "claude-sonnet-4-5",
"messages": [
{
"role": "system",
"content": "You are a skilled cloud-native network engineer."
},
{
"role": "user",
"content": "Write me a paragraph containing the best way to think about Istio Ambient Mesh"
}
]
}' | jqcurl "$INGRESS_GW_ADDRESSTHREE:8080/anthropic" -v \ -H content-type:application/json -H x-api-key:$ANTHROPIC_API_KEY -H "anthropic-version: 2023-06-01" -d '{
"model": "claude-sonnet-4-5",
"messages": [
{
"role": "system",
"content": "You are a skilled cloud-native network engineer."
},
{
"role": "user",
"content": "Write me a paragraph containing the best way to think about Istio Ambient Mesh"
}
]
}' | jqMetrics Testing
Now that everything is deployed, you can start checking the metrics for Token cost/usage, LLM cost, and see it all for every Gateway within the same dashboard.
- Port-forward Prometheus
kubectl port-forward -n monitoring svc/kube-prometheus-stack-prometheus 9090:9090- Check Token usage.
curl -s 'http://localhost:9090/api/v1/query?query=agentgateway:input_tokens:total' | jq '.data.result[0].value'- Check the overall cost.
curl -s 'http://localhost:9090/api/v1/query?query=agentgateway:cost_usd:total_daily' | jq '.data.result[0].value'You should see outputs similar to the below:
[
  1763214193.134,
  "41.31458333333333"
]
[
1763214214.598,
"0.0008821471428571428"
]- Go to the Grafana Dashboard and you'll now see all of the Gateway costs per Gateway.

Comments ()