Observability & Telemetry in Istio Deep Dive
Without a good understanding of how Services are performing, you'll never truly know what's important to focus on when optimizing environments, and that's a make or break between happy customers (including internal engineers) and people who are scrambling to find a solution.
As we all know, the last thing any organization wants is to figure out that there's an issue within an application stack from a customer. That's where proper telemetry, metrics, and overall observability come into play.
In this blog post, you'll learn how to set up, from start to finish, telemetry and metrics data capture for Istio.
Prerequisites
To follow along with this blog post in a hands-on fashion, you'll want to have the following:
- A running Kubernetes cluster. For the purposes of this post, AKS was used, but you can use any managed k8s service or local cluster solution (e.g - Kind, Minikube, etc.).
- Istio Ambient Mesh installed. If you haven't installed Ambient, you can learn how to do so here.
Istio Metrics Breakdown
By default, Istio exposes a ton of metrics and observability endpoints, including request count, size of a request, duration, and many other metrics that fall under HTTP and gRPC. The goal with metrics is to understand:
- Who/what tries to connect to a service
- What Services are trying to connect to other Services
- What type of traffic/packets are flowing within your environment.
Istio generates telemetry that it calls the four golden signals (latency, traffic, errors, and saturation) to ensure that you collect everything necessary to troubleshoot and understand what's going on within your environment.
You can find a full list of metrics here.
When it comes to Ambient Mesh, you'll have two sets (aside from Istiod metrics) of metrics/telemetry exposed from:
- Ztunnel Proxy
- Waypoints
Ztunnel handles all L4 traffic (service-to-service communication and mTLS) and Waypoints are all about L7 (advanced routing and policies).
The breakdown you'll usually see is that Ztunnel generates TCP metrics for all of the Kubernetes Services that are enrolled into the mesh (istio_tcp_connections_opened, istio_tcp_received_bytes, etc.) and Waypoints generate request/response metrics for HTTP, HTTP/2 and gRPC traffic.
Mesh Enterprise
Gloo Mesh comes with the ability to expose and collect L7 tracing via the built-in telemetry pipeline without having to implement L7 Waypoints. It does this by adding L7 parsing directly into the Ztunnel Proxy to provide L7 attributes for telemetry via a built-in HTTP parser. This is great for Services enrolled in the Mesh that may be exposing L7 metrics/telemetry data
Prometheus Setup
Now that you know what metrics and telemetry data to expect to see within Istio and Ambient Mesh, let's dive into the setup.
For the configuration, you'll use Kube-Prometheus for the monitoring and observability stack.
When setting up Prometheus, by default, it's not going to capture the metrics and telemetry data from Istiod and Ztunnel. Prometheus needs to be configured to do so. To configure these settings, you'll use the ServiceMonitor and PodMonitor object/kind in a Kubernetes manifest using the http://monitoring.coreos.com/v1API/CRD.
For the metrics/telemetry data from Istiod, the metrics are exposed over port 15014. For Ztunnel, the target will be port 15020. Ztunnel metrics can be scraped from the /metrics endpoint.
Since Ztunnel is a DaemonSet (node-level proxy) by default, you can use PodMonitor to capture those Metrics as Pods will be deployed for Ztunnel, not a Service.
Kube-Prometheus Installation
- Add the Kube-Prometheus Helm Chart.
helm repo add prometheus-community https://prometheus-community.github.io/helm-charts- Install the Helm Chart.
helm install kube-prometheus -n monitoring prometheus-community/kube-prometheus-stack --create-namespace- Ensure that you can reach both the Prometheus Service and the Grafana Service.
kubectl --namespace monitoring port-forward svc/kube-prometheus-kube-prome-prometheus 9090kubectl --namespace monitoring port-forward svc/kube-prometheus-grafana 3000:80To log into Grafana:
1. Username: admin
2. Password: prom-operator
Service Monitor Setup
- Deploy the
ServiceMonitorandPodMonitorconfigs below to start capturing Istiod and Ztunnel metrics.
Sidenote: You'll notice the release: kube-prometheus parameter in the following two configs. That's because Kube-Prometheus is deployed/used for this blog post. If you're just using a standard instance of Prometheus, you wouldn't that parameter.
kubectl apply -f - <<EOF
apiVersion: monitoring.coreos.com/v1
kind: ServiceMonitor
metadata:
  name: istiod
  namespace: monitoring
  labels:
    release: kube-prometheus  # Required for Prometheus to discover this ServiceMonitor
spec:
  selector:
    matchLabels:
      app: istiod
  namespaceSelector:
    matchNames:
      - istio-system
  endpoints:
  - port: http-monitoring
    interval: 30s
    path: /metrics
EOF
You'll now be able to see Istio metrics.
For Ztunnel, because it's a DaemoSet and not a Service, PodMonitor is used into of ServiceMonitor.
kubectl apply -f - <<EOF
apiVersion: monitoring.coreos.com/v1
kind: PodMonitor
metadata:
name: ztunnel
namespace: monitoring
labels:
release: kube-prometheus # Required for Prometheus to discover this PodMonitor
spec:
selector:
matchLabels:
app: ztunnel
namespaceSelector:
matchNames:
- istio-system
podMetricsEndpoints:
- port: ztunnel-stats
interval: 30s
path: /stats/prometheus
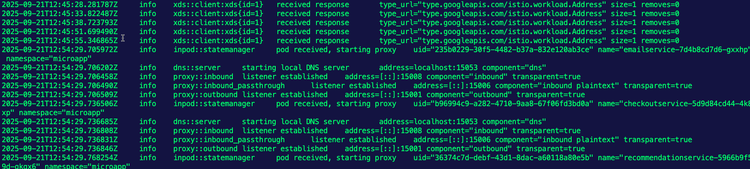
EOFThe top Ztunnel metrics you can see are:
istio_tcp_connections_openedistio_tcp_connections_closedistio_xds_connection_terminations_total
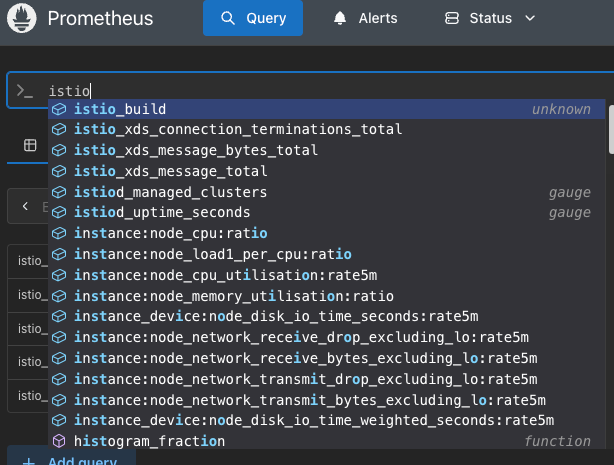
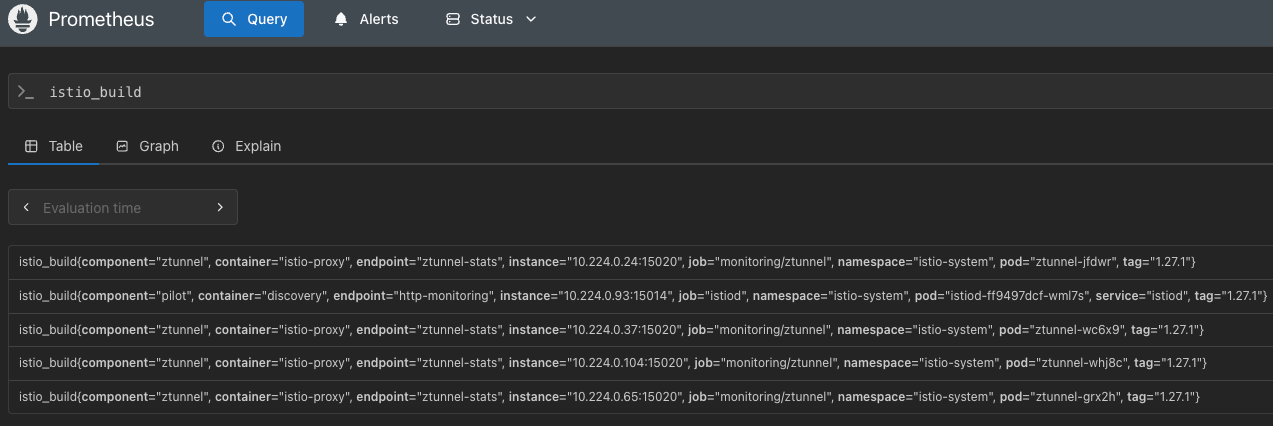
You can also see that Ztunnel is configured via the istio_build metric.
Grafana Setup
Now that you know the metrics and telemetry data are being captured, it's time to take a look at the visuals. To do that, you can set up dashboards in Grafana.
- Log into Grafana
kubectl --namespace monitoring port-forward svc/kube-prometheus-grafana 3000:80
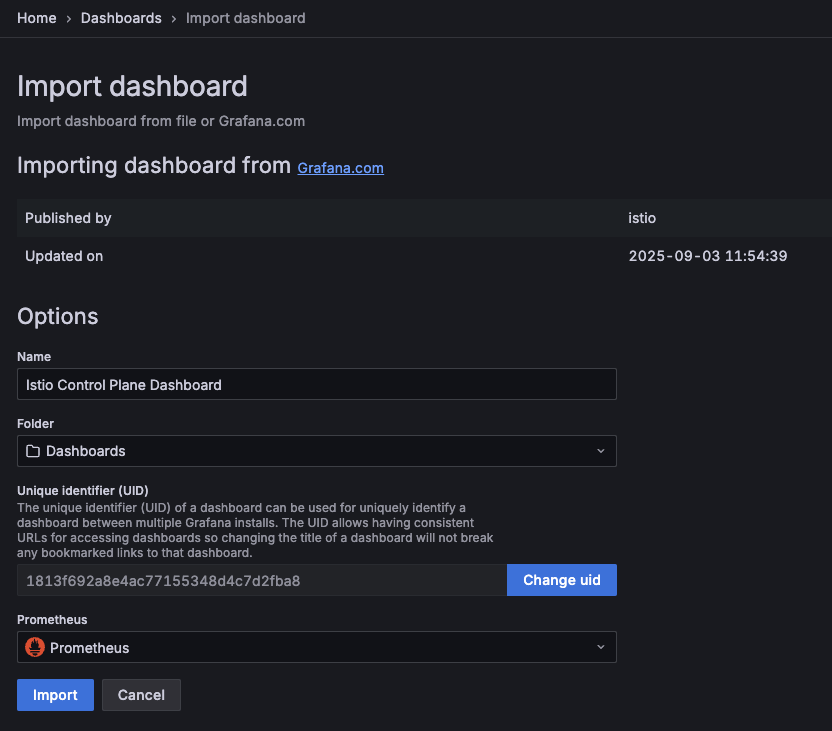
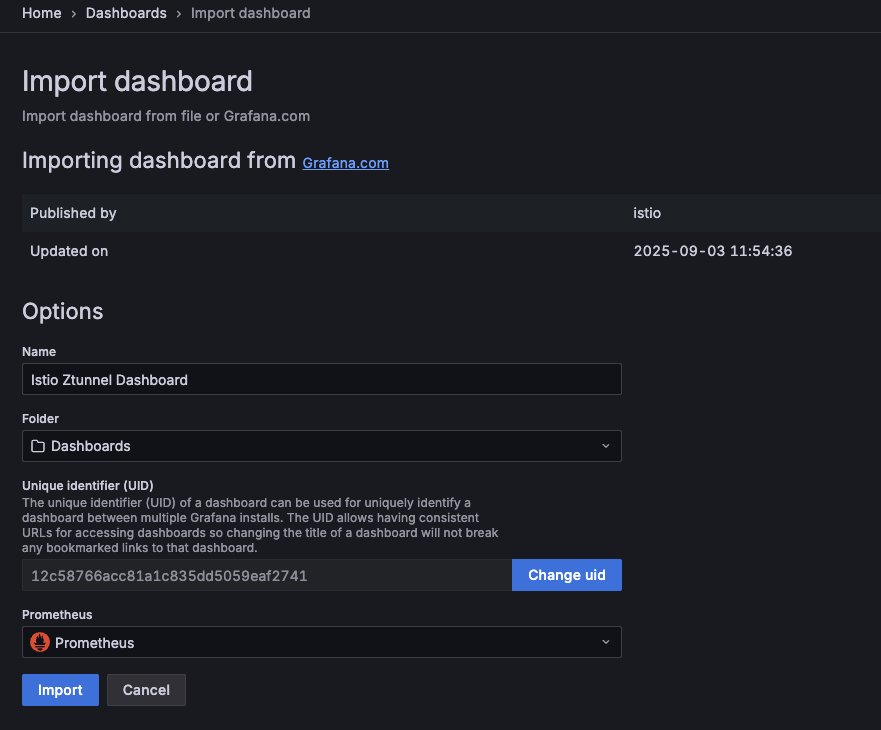
Forwarding from 127.0.0.1:3000 -> 3000- Go to the Dashboards, click the blue New button, and then click the Import button.
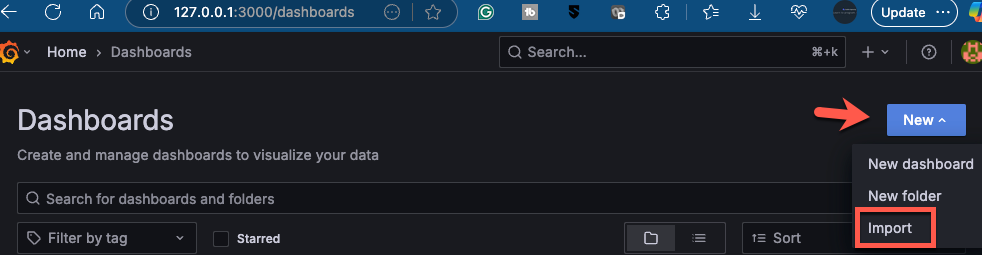
- There are several dashboards available, but for the purposes of this blog post, you can use the following:
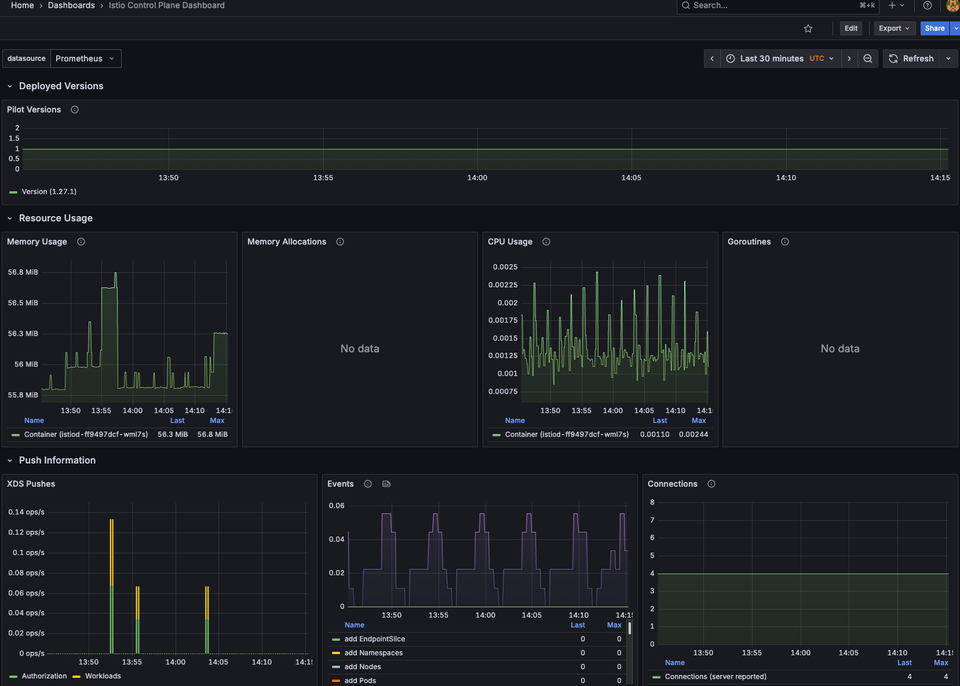
- Istio Control Plane dashboard
- Ztunnel Dashboard
The two IDs are:
- For Istiod: 7645
- For Ztunnel: 21306
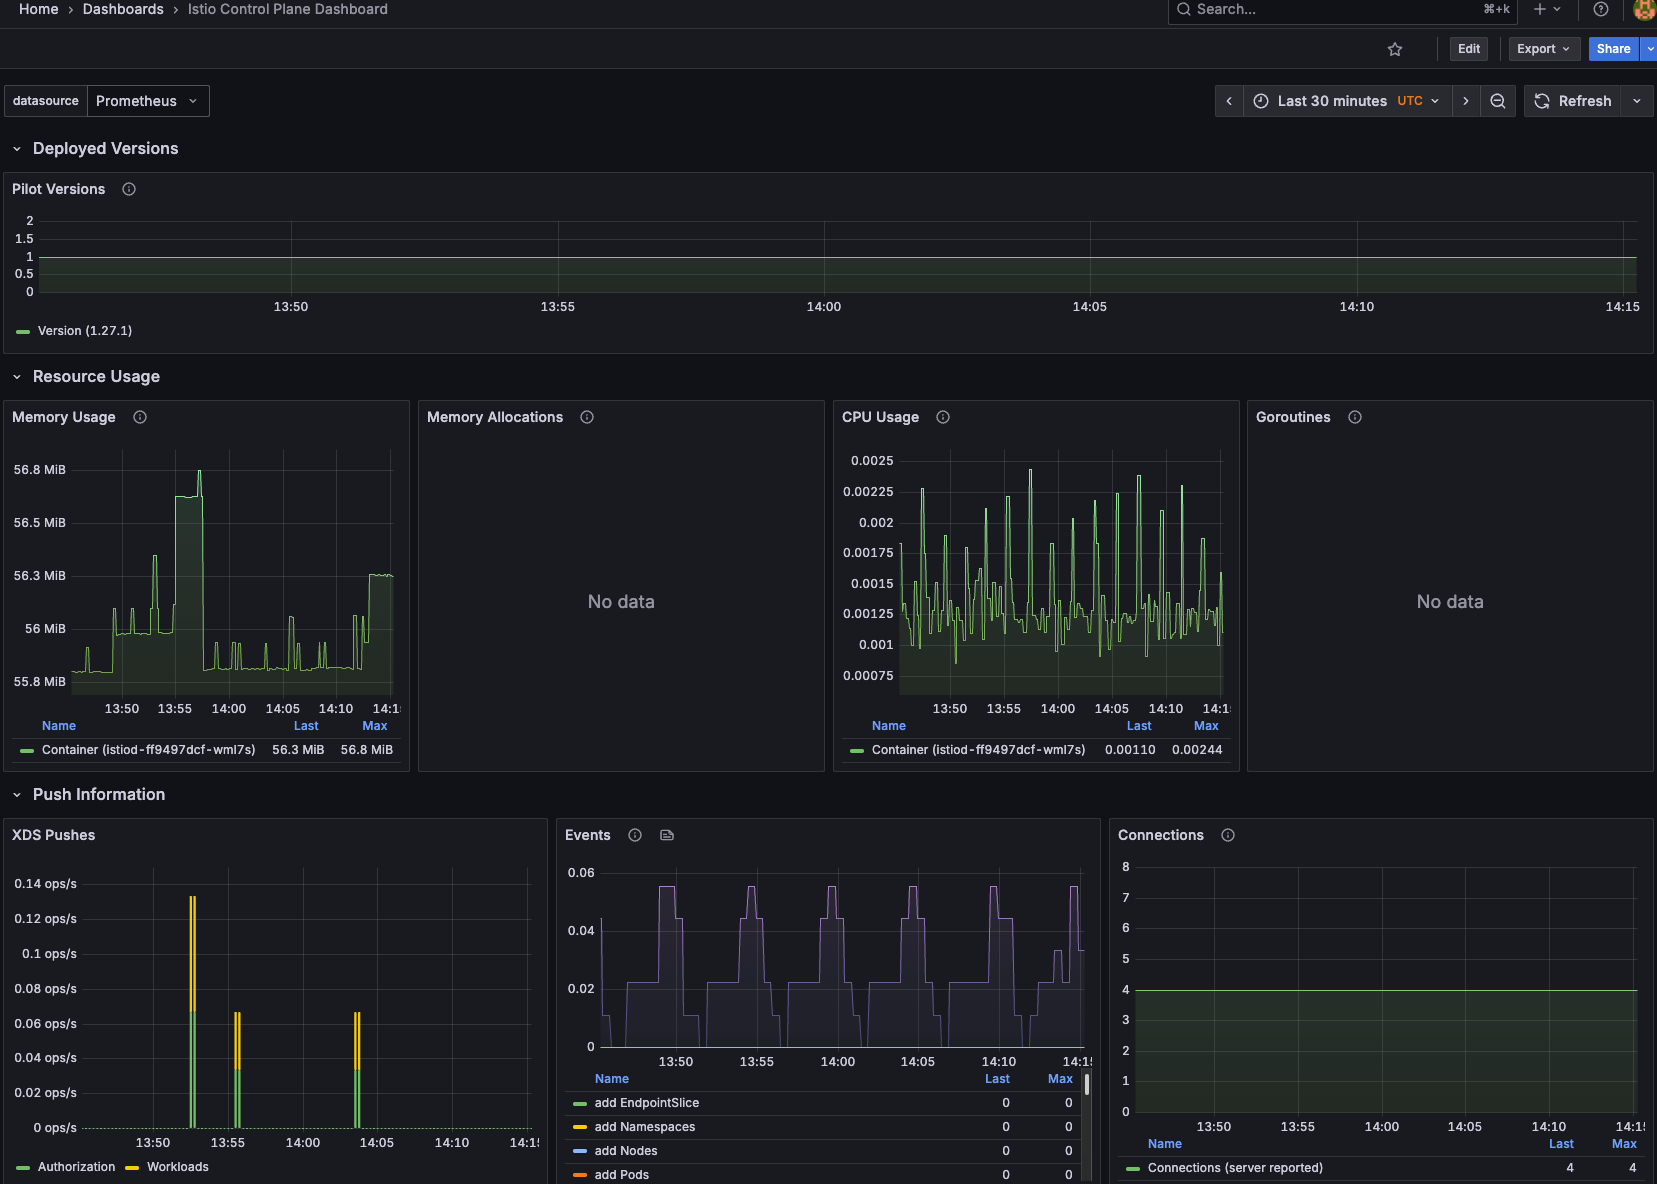
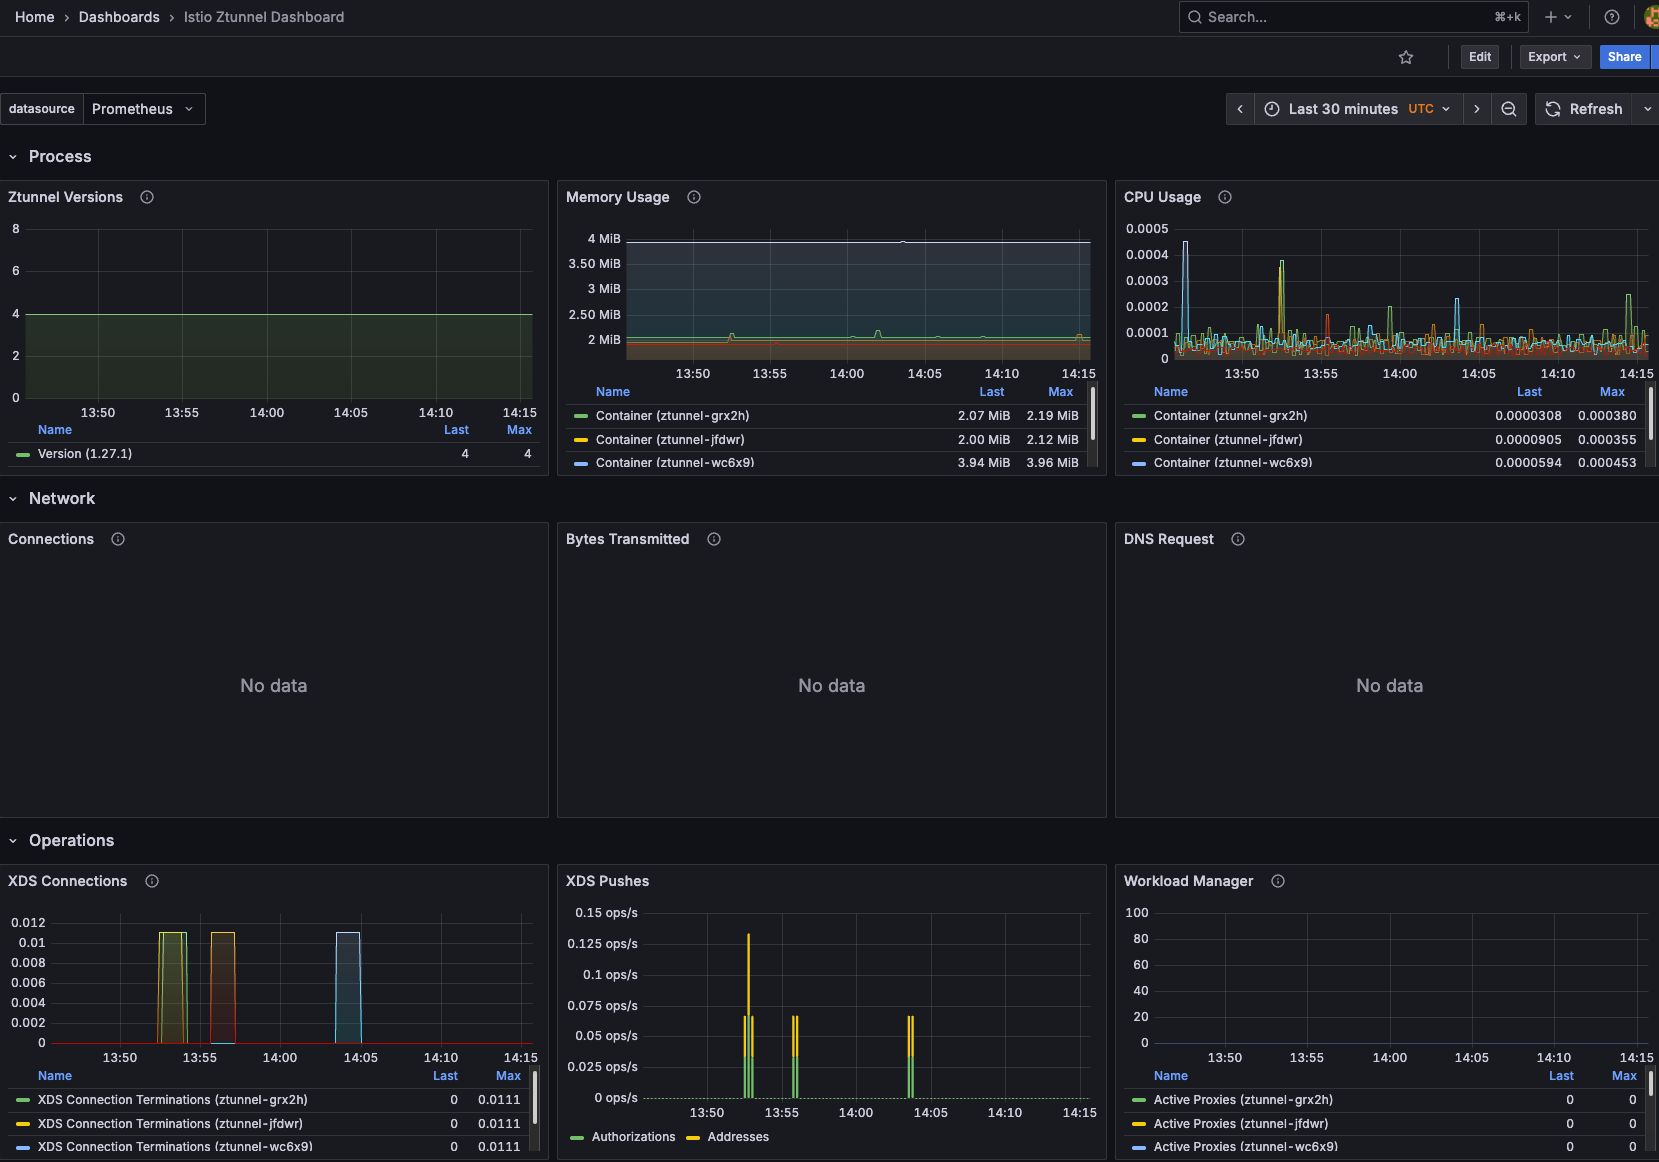
You'll see the proper dashboard associated with Istiod and Ztunnel. Make sure that you choose Prometheus as the data source.
You can now see data for both Istiod and Zunntel!
Kiali
If you want to go a bit deeper into understanding how Services are talking to each other, the overall health, and validation of what Services are communicating and how it's all connected from a graphical standpoint, you can use Kiali, which is an open-source graph.
- Add the Kiali Helm Chart.
helm repo add kiali https://kiali.org/helm-charts- Install the Kiali Helm Chart.
helm install kiali-server kiali/kiali-server \
  -n istio-system \
  --set auth.strategy="anonymous" \
  --set external_services.prometheus.url="http://kube-prometheus-kube-prome-prometheus.monitoring.svc.cluster.local:9090"
Notice the data source is kube-prometheus.
kubectl apply -f https://raw.githubusercontent.com/istio/istio/release-1.27/samples/addons/kiali.yamlBy default, it expects that you also used the samples to install Prometheus, so it won't be pointing to the right data source if you followed this guide.
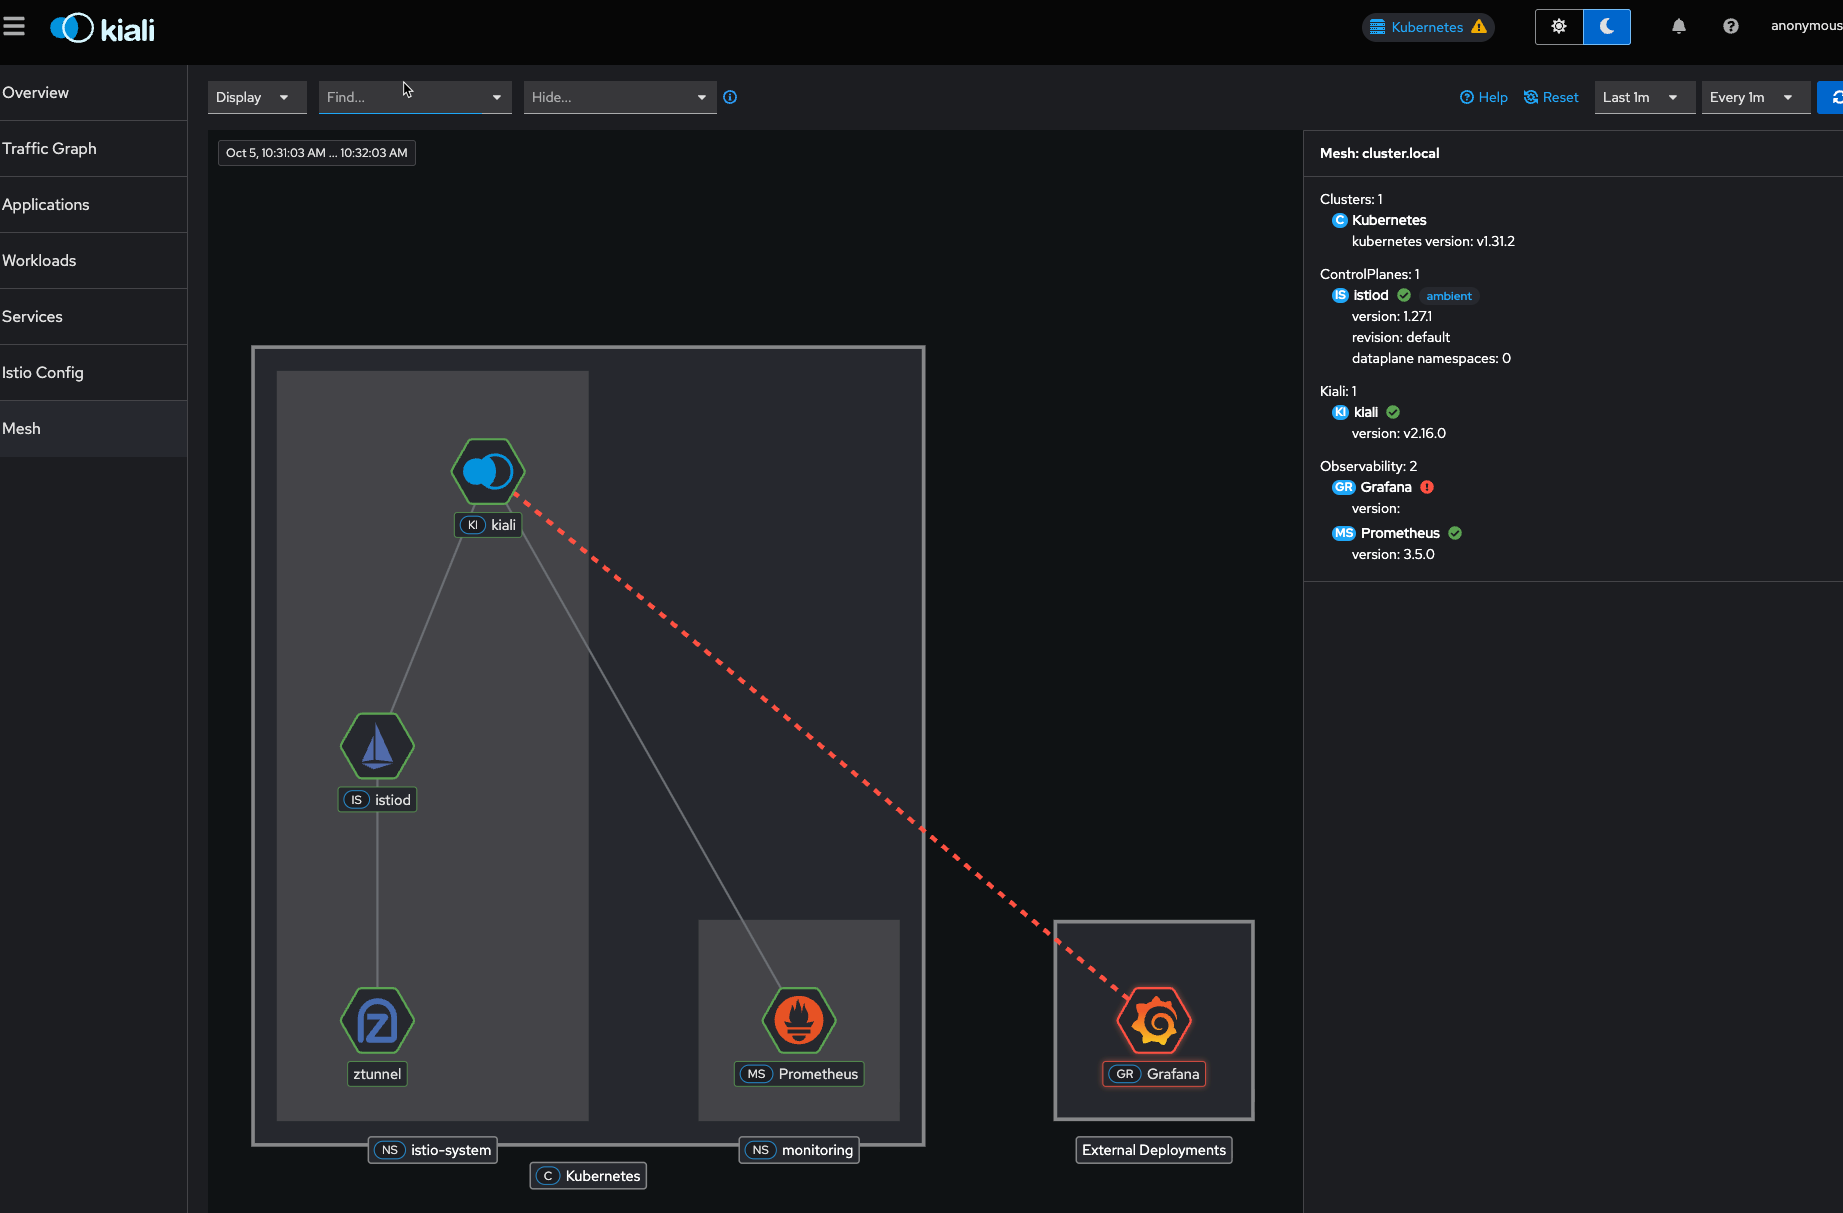
- Access the Kiali dashboard.
kubectl port-forward -n istio-system svc/kiali 20001:20001You won't see data in the traffic graph as it's a new deployment, but you can confirm everything is working by clicking on the Mesh pane.
Conclusion
Monitoring, Observability (metrics/traces/logs) and ensuring that you pull the right data from your application stack are crucial. In the world of networking when it comes to Services enrolled in a Service Mesh, proper metrics and telemetry are really the only way you can know if your application stack is performing as expected.

Comments ()