Implementing Observability For Agent Substrate Actors
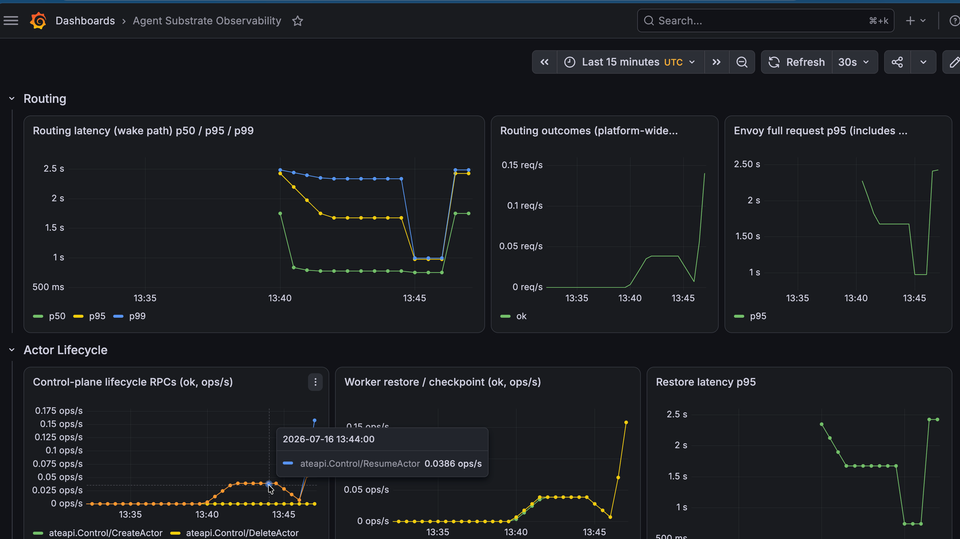
Sandboxed Agents means we're going a level deeper in terms of where AI runs. Originally, it could be an Agent Harness like opencode or Codex running on your local terminal. Now, it's a small entity running inside a Pod as a process.
That means, by default, you're even more separated from seeing what occurs with your own eyes.
In this blog, you'll learn how to take the layer of blindness off by scraping metrics from your Agent Substrate Actor (where your Agents run) and exposing them in a dashboard so you can see performance and the overall lifecycle of how your Agents are interacted with.
Prerequisites
To follow along with this blog from a hands-on perspective, you will need the following:
- A Kubernetes cluster
- Agent Substrate installed
Quick Substrate Setup
If you pull down the Substrate repo found here, you will see that there's an example .ate-dev-env.sh. That allows you to have environment variables for your environment where Substrate is installed.
- Install the counter demo so you have Actors deployed to test out observability.
./hack/install-ate.sh --deploy-demo-counter- Ensure
kubectl-ate(the CLI tool to interact with Substrate) is installed.
go install ./cmd/kubectl-ate- Confirm the demo resources exist:
kubectl get actortemplate,workerpool -n ate-demo-counterPrometheus and Grafana Configuration
With the Subtrate, Actors, and the WorkerPool set up, you can officially run traffic through Actors, but how will you observe said traffic? Prometheus and Grafana give you an OSS method of scraping/collecting metrics and giving a visual of said metrics.
- Install
kube-prometheusinto a dedicatedmonitoringNamespace.
helm repo add prometheus-community https://prometheus-community.github.io/helm-charts

helm repo update prometheus-community

helm upgrade --install monitoring \
  prometheus-community/kube-prometheus-stack \
  --namespace monitoring --create-namespace \
  --set alertmanager.enabled=false \
  --set prometheus.prometheusSpec.podMonitorSelectorNilUsesHelmValues=false \
--set prometheus.prometheusSpec.serviceMonitorSelectorNilUsesHelmValues=false- Ensure it's running as expected.
kubectl get pods -n monitoringYou can now begin to scrape the metrics.
Scrape Substrate Metrics
A Pod Monitor allows you to specify what resources you want to scrape. In this case, it's the ate-api-server (the Substrate control plane)`, atelet (manages Worker Pods), and the atenet-router.
- Apply the following configmap.
kubectl apply -f - <<'EOF'
apiVersion: monitoring.coreos.com/v1
kind: PodMonitor
metadata:
  name: substrate-services
  namespace: monitoring
spec:
  namespaceSelector:
    matchNames: [ate-system]
  selector:
    matchExpressions:
    - key: app
      operator: In
      values: [ate-api-server, atelet, atenet-router]
  podMetricsEndpoints:
  - portNumber: 9090
    path: /metrics
    interval: 15s
---
apiVersion: monitoring.coreos.com/v1
kind: PodMonitor
metadata:
  name: substrate-envoy
  namespace: monitoring
spec:
  namespaceSelector:
    matchNames: [ate-system]
  selector:
    matchLabels:
      app: atenet-router
  podMetricsEndpoints:
  - portNumber: 9901
    path: /stats/prometheus
    interval: 15s
EOF- Port-forward to access Prometheus and you will be able to see calls to Substrate.
kubectl -n monitoring port-forward svc/monitoring-kube-prometheus-prometheus 9090:9090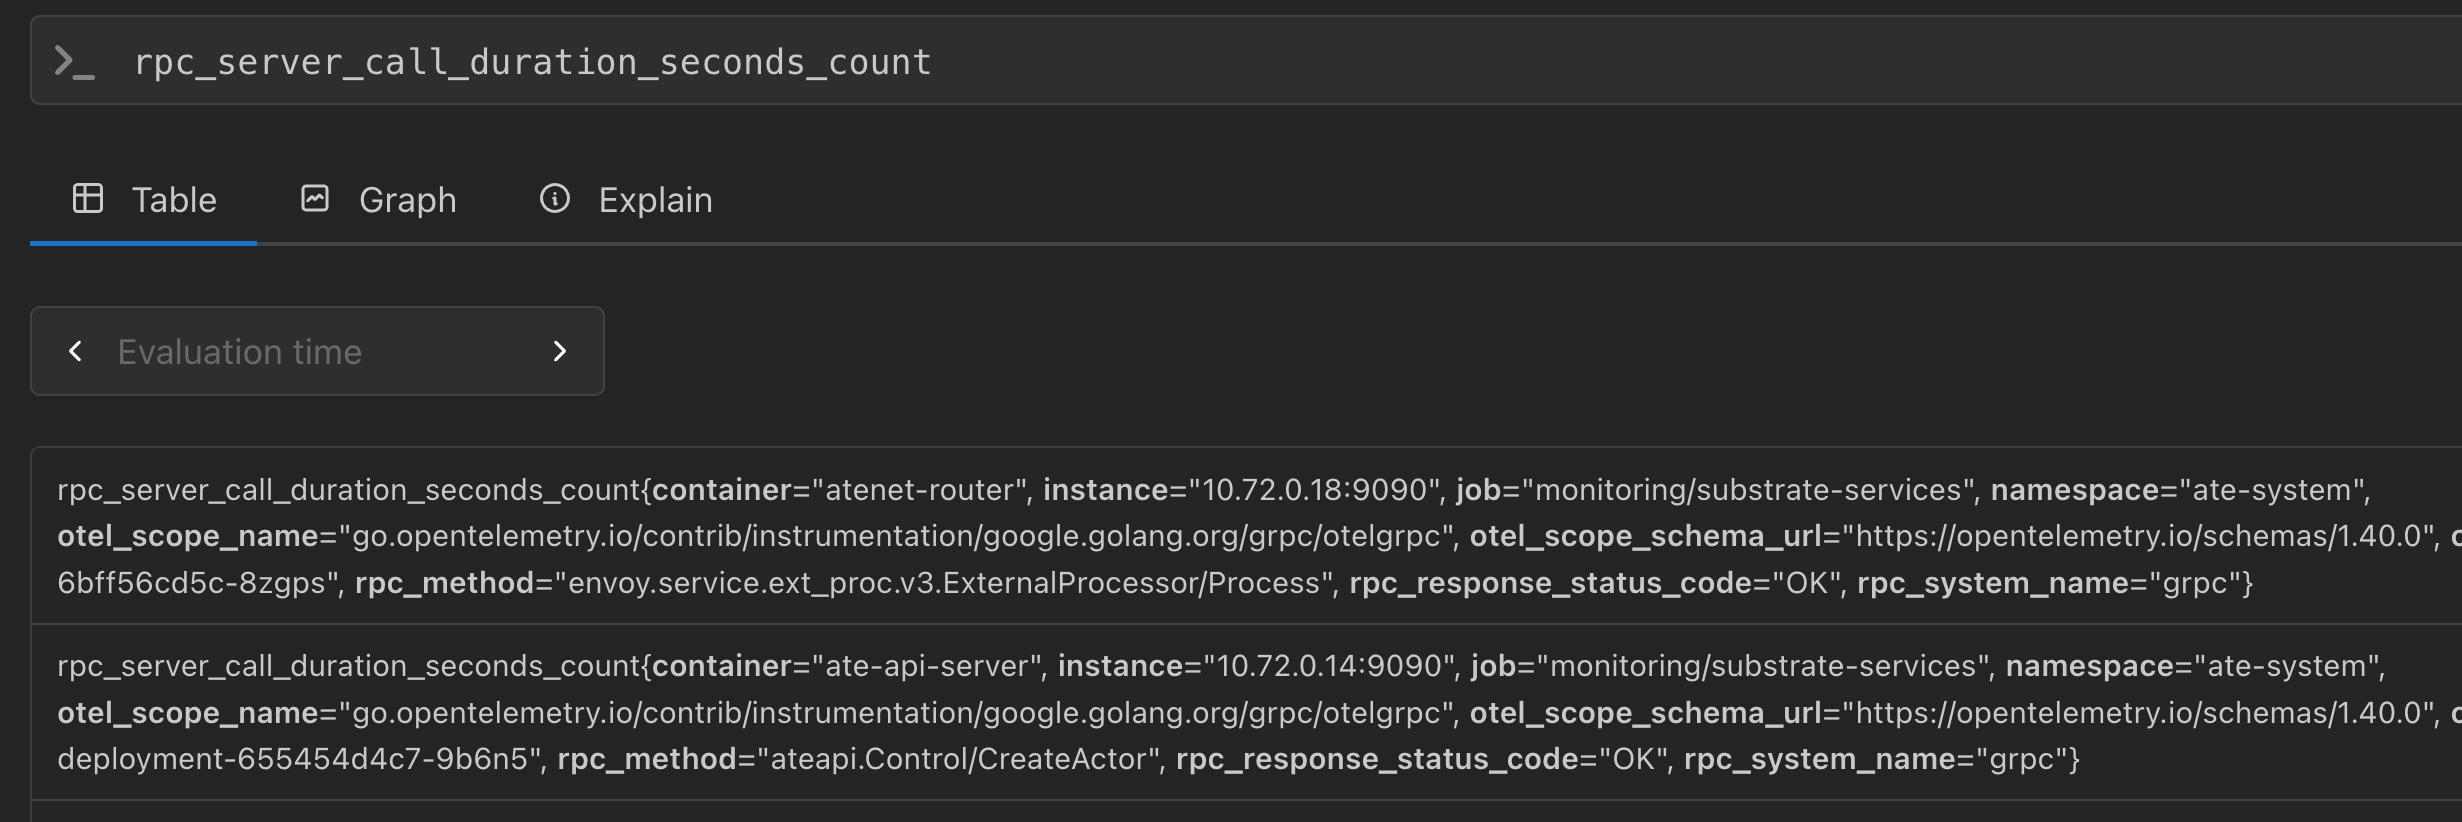
- After confirming the metrics exist, provision the Grafana dashboard.
kubectl apply -f - <<'EOF'
apiVersion: v1
kind: ConfigMap
metadata:
  name: substrate-observability-dashboard
  namespace: monitoring
  labels:
    grafana_dashboard: "1"
data:
  substrate-observability.json: |
    {
      "title": "Agent Substrate Observability",
      "uid": "substrate-obs",
      "timezone": "utc",
      "refresh": "30s",
      "time": { "from": "now-30m", "to": "now" },
      "panels": [
        { "type": "row", "title": "Routing", "gridPos": {"h": 1, "w": 24, "x": 0, "y": 0} },
        {
          "type": "timeseries", "title": "Routing latency (wake path) p50 / p95 / p99",
          "gridPos": {"h": 8, "w": 12, "x": 0, "y": 1},
          "datasource": { "type": "prometheus", "uid": "prometheus" },
          "fieldConfig": { "defaults": { "unit": "s" }, "overrides": [] },
          "targets": [
            { "refId": "A", "datasource": { "type": "prometheus", "uid": "prometheus" }, "expr": "histogram_quantile(0.50, sum by (le) (rate(atenet_router_route_duration_seconds_bucket{actor_template_namespace=\"ate-demo-counter\", actor_template_name=\"counter\", outcome=\"ok\"}[5m])))", "legendFormat": "p50" },
            { "refId": "B", "datasource": { "type": "prometheus", "uid": "prometheus" }, "expr": "histogram_quantile(0.95, sum by (le) (rate(atenet_router_route_duration_seconds_bucket{actor_template_namespace=\"ate-demo-counter\", actor_template_name=\"counter\", outcome=\"ok\"}[5m])))", "legendFormat": "p95" },
            { "refId": "C", "datasource": { "type": "prometheus", "uid": "prometheus" }, "expr": "histogram_quantile(0.99, sum by (le) (rate(atenet_router_route_duration_seconds_bucket{actor_template_namespace=\"ate-demo-counter\", actor_template_name=\"counter\", outcome=\"ok\"}[5m])))", "legendFormat": "p99" }
          ]
        },
        {
          "type": "timeseries", "title": "Routing outcomes (platform-wide, req/s)",
          "gridPos": {"h": 8, "w": 6, "x": 12, "y": 1},
          "datasource": { "type": "prometheus", "uid": "prometheus" },
          "fieldConfig": { "defaults": { "unit": "reqps" }, "overrides": [] },
          "targets": [
            { "refId": "A", "datasource": { "type": "prometheus", "uid": "prometheus" }, "expr": "sum by (outcome) (rate(atenet_router_route_duration_seconds_count[5m]))", "legendFormat": "{{outcome}}" }
          ]
        },
        {
          "type": "timeseries", "title": "Envoy full request p95 (includes actor time)",
          "gridPos": {"h": 8, "w": 6, "x": 18, "y": 1},
          "datasource": { "type": "prometheus", "uid": "prometheus" },
          "fieldConfig": { "defaults": { "unit": "ms" }, "overrides": [] },
          "targets": [
            { "refId": "A", "datasource": { "type": "prometheus", "uid": "prometheus" }, "expr": "histogram_quantile(0.95, sum by (le) (rate(envoy_http_downstream_rq_time_bucket{envoy_http_conn_manager_prefix=\"ingress_http\"}[5m])))", "legendFormat": "p95" }
          ]
        },
        { "type": "row", "title": "Actor Lifecycle", "gridPos": {"h": 1, "w": 24, "x": 0, "y": 9} },
        {
          "type": "timeseries", "title": "Control-plane lifecycle RPCs (ok, ops/s)",
          "gridPos": {"h": 8, "w": 8, "x": 0, "y": 10},
          "datasource": { "type": "prometheus", "uid": "prometheus" },
          "fieldConfig": { "defaults": { "unit": "ops" }, "overrides": [] },
          "targets": [
            { "refId": "A", "datasource": { "type": "prometheus", "uid": "prometheus" }, "expr": "sum by (rpc_method) (rate(rpc_server_call_duration_seconds_count{rpc_method=~\"ateapi.Control/(Create|Resume|Suspend|Pause|Delete)Actor\", rpc_response_status_code=\"OK\"}[5m]))", "legendFormat": "{{rpc_method}}" }
          ]
        },
        {
          "type": "timeseries", "title": "Worker restore / checkpoint (ok, ops/s)",
          "gridPos": {"h": 8, "w": 8, "x": 8, "y": 10},
          "datasource": { "type": "prometheus", "uid": "prometheus" },
          "fieldConfig": { "defaults": { "unit": "ops" }, "overrides": [] },
          "targets": [
            { "refId": "A", "datasource": { "type": "prometheus", "uid": "prometheus" }, "expr": "sum by (rpc_method) (rate(rpc_server_call_duration_seconds_count{rpc_method=~\"atelet.AteomHerder/(Restore|Checkpoint)\", rpc_response_status_code=\"OK\"}[5m]))", "legendFormat": "{{rpc_method}}" }
          ]
        },
        {
          "type": "timeseries", "title": "Restore latency p95",
          "gridPos": {"h": 8, "w": 8, "x": 16, "y": 10},
          "datasource": { "type": "prometheus", "uid": "prometheus" },
          "fieldConfig": { "defaults": { "unit": "s" }, "overrides": [] },
          "targets": [
            { "refId": "A", "datasource": { "type": "prometheus", "uid": "prometheus" }, "expr": "histogram_quantile(0.95, sum by (le) (rate(rpc_server_call_duration_seconds_bucket{rpc_method=\"atelet.AteomHerder/Restore\", rpc_response_status_code=\"OK\"}[5m])))", "legendFormat": "p95" }
          ]
        },
        {
          "type": "timeseries", "title": "gRPC non-OK responses (ops/s)",
          "gridPos": {"h": 8, "w": 8, "x": 0, "y": 18},
          "datasource": { "type": "prometheus", "uid": "prometheus" },
          "fieldConfig": { "defaults": { "unit": "ops" }, "overrides": [] },
          "targets": [
            { "refId": "A", "datasource": { "type": "prometheus", "uid": "prometheus" }, "expr": "sum by (rpc_method, rpc_response_status_code) (rate(rpc_server_call_duration_seconds_count{rpc_response_status_code!=\"OK\"}[5m]))", "legendFormat": "{{rpc_method}} {{rpc_response_status_code}}" }
          ]
        },
        { "type": "row", "title": "Snapshots", "gridPos": {"h": 1, "w": 24, "x": 0, "y": 26} },
        {
          "type": "timeseries", "title": "Snapshot file size p95 (by kind)",
          "gridPos": {"h": 8, "w": 12, "x": 0, "y": 27},
          "datasource": { "type": "prometheus", "uid": "prometheus" },
          "fieldConfig": { "defaults": { "unit": "bytes" }, "overrides": [] },
          "targets": [
            { "refId": "A", "datasource": { "type": "prometheus", "uid": "prometheus" }, "expr": "histogram_quantile(0.95, sum by (le, kind) (rate(atelet_snapshot_size_bytes_bucket{actor_template_namespace=\"ate-demo-counter\", actor_template_name=\"counter\"}[5m])))", "legendFormat": "{{kind}} p95" }
          ]
        },
        {
          "type": "timeseries", "title": "Checkpoints completed vs snapshot files observed (platform-wide, ops/s)",
          "gridPos": {"h": 8, "w": 12, "x": 12, "y": 27},
          "datasource": { "type": "prometheus", "uid": "prometheus" },
          "fieldConfig": { "defaults": { "unit": "ops" }, "overrides": [] },
          "targets": [
            { "refId": "A", "datasource": { "type": "prometheus", "uid": "prometheus" }, "expr": "sum(rate(rpc_server_call_duration_seconds_count{rpc_method=\"atelet.AteomHerder/Checkpoint\", rpc_response_status_code=\"OK\"}[5m]))", "legendFormat": "checkpoints/s" },
            { "refId": "B", "datasource": { "type": "prometheus", "uid": "prometheus" }, "expr": "sum(rate(atelet_snapshot_size_bytes_count[5m]))", "legendFormat": "snapshot files/s (recorded pre-upload)" }
          ]
        }
      ],
      "schemaVersion": 39
    }
EOF
You can now access the dashboard with the following:
- Port-forward to the Grafana dashboard:
kubectl -n monitoring port-forward svc/monitoring-grafana 3000:80 - Use
adminas the username to log in. - Use the password from the charts managed password:
kubectl get secret monitoring-grafana -n monitoring -o jsonpath='{.data.admin-password}' | base64 -d; echo
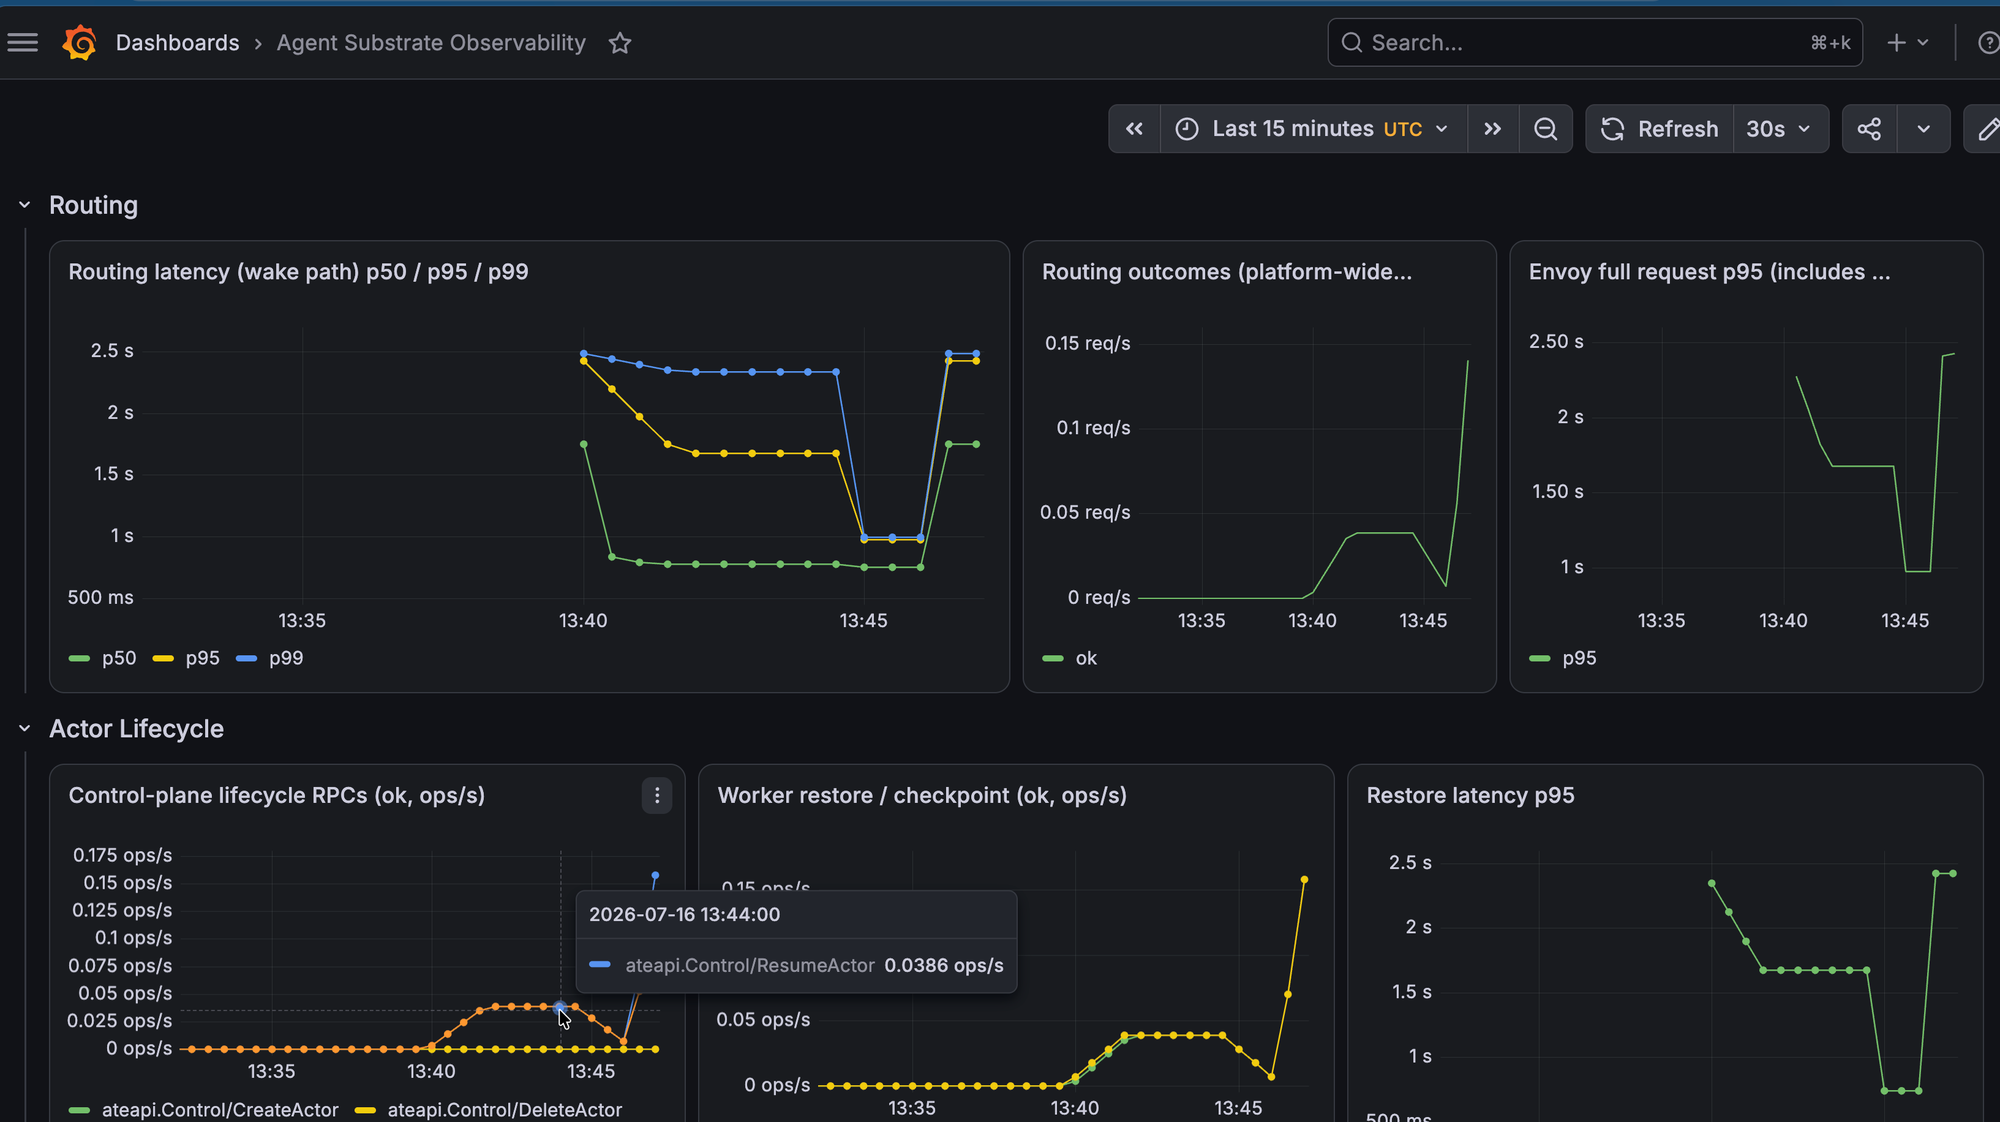
If you open the Dashboards tab, you'll see a dashboard called Agent Substrate Observability.
View The Grafana Dashboard
By default, you'll begin to see some metrics within the dashboard show up, but not a whole lot because you have generated traffic to the deployed Actors.
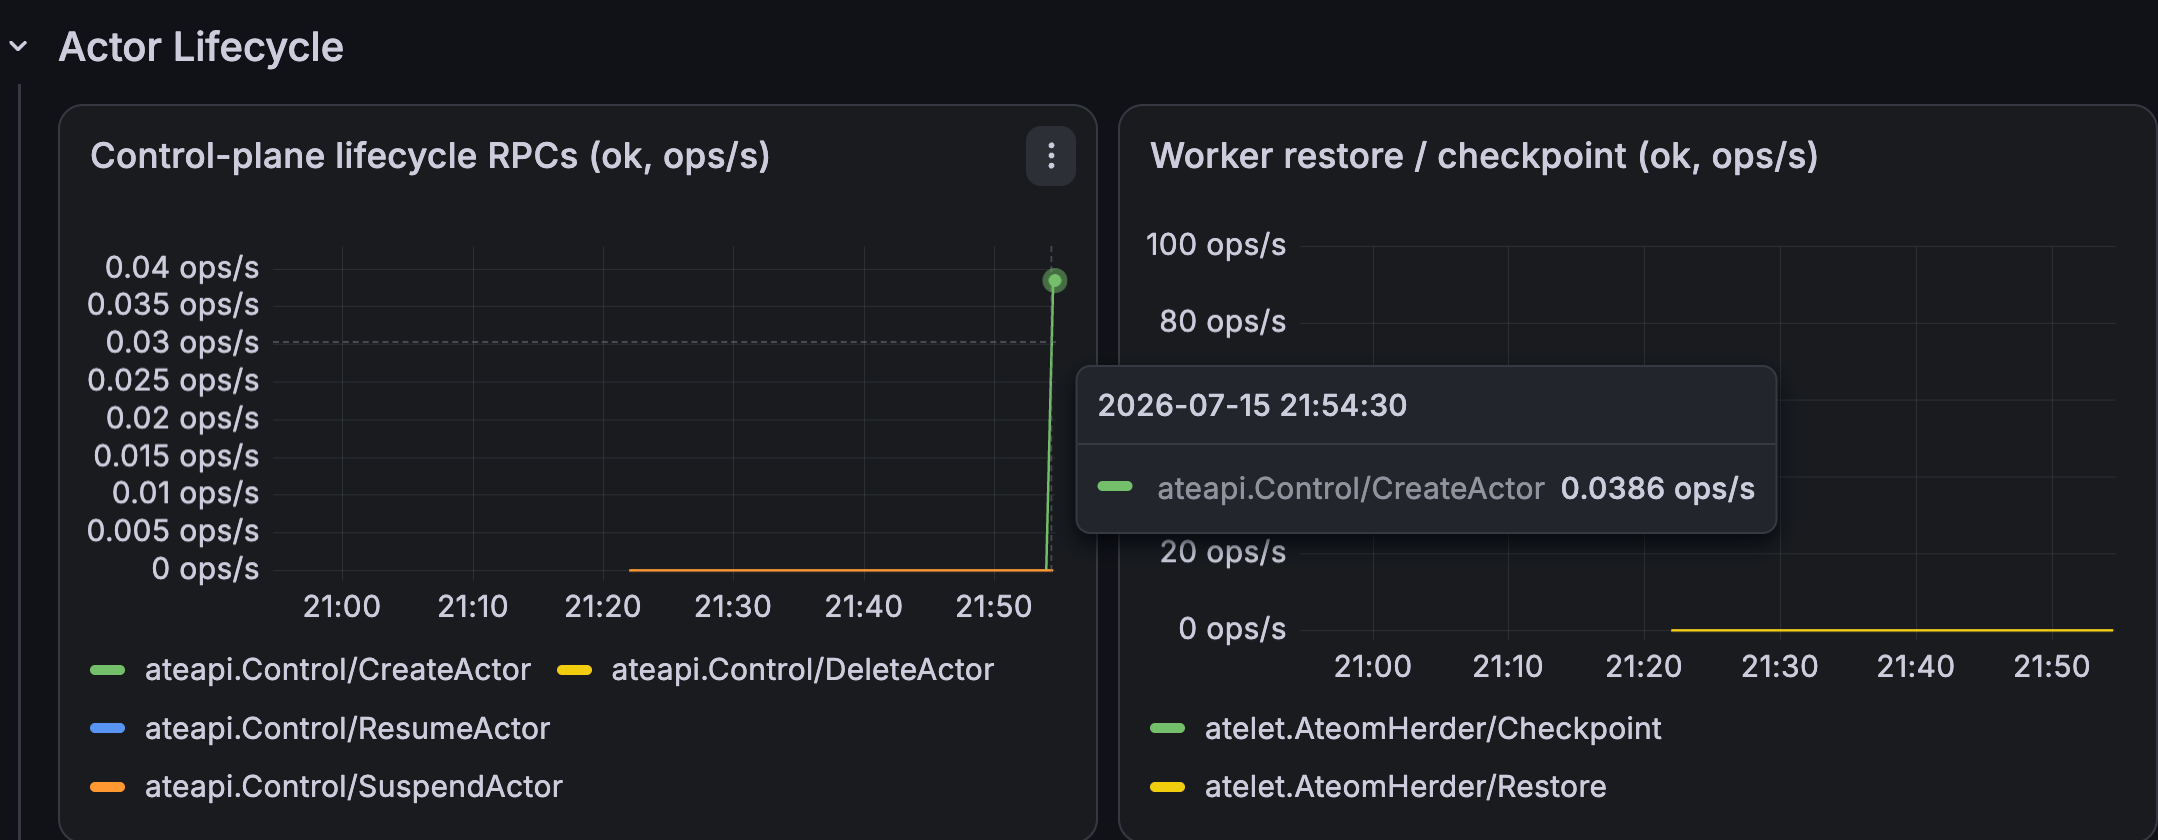
Let's now generate some heavy traffic so you can begin to see real metrics being shown in a visual fashion.
Prepare And Create Actors.
- Set the proper environment variables for which Actors to reach and where the Actors exist.
export ACTOR_COUNT=20
export OBS_NAMESPACE=observability
export OBS_ATESPACE=observability
export OBS_ACTOR_PREFIX=obs-counter
export TEMPLATE_REF=ate-demo-counter/counter
export WORKER_NAMESPACE=ate-demo-counter
export SUBSTRATE_ROUTER_URL=http://atenet-router.ate-system.svc:80
export OBS_DURATION_SECONDS=600
export OBS_RESULTS_FILE=observability-wake-results.tsv- Create the Namespace and benchmark client.
kubectl create namespace "$OBS_NAMESPACE" \
--dry-run=client -o yaml | kubectl apply -f -- Run the benchmark client.
kubectl run benchmark-client \
  -n "$OBS_NAMESPACE" \
  --image=curlimages/curl:8.10.1 \
  --restart=Never \
  --command -- sleep 86400

kubectl wait --for=condition=Ready pod/benchmark-client \
  -n "$OBS_NAMESPACE" \
--timeout=2m- Create the Substrate space if it's not already created.
if ! kubectl ate get atespace "$OBS_ATESPACE" >/dev/null 2>&1; then
  kubectl ate create atespace "$OBS_ATESPACE"
fi
5
- Create the Actors.
for i in $(seq 1 "$ACTOR_COUNT"); do
  actor=$(printf '%s-%03d' "$OBS_ACTOR_PREFIX" "$i")

  if ! kubectl ate get actor "$actor" \
    --atespace "$OBS_ATESPACE" >/dev/null 2>&1; then
    kubectl ate create actor "$actor" \
      --template "$TEMPLATE_REF" \
      --atespace "$OBS_ATESPACE"
  fi
done- Confirm that the Actors are in a "suspended" state, which makes sense as Actors aren't running unless they're being interacted with.
kubectl ate get actors --atespace "$OBS_ATESPACE"
kubectl ate get workers
Generate Traffic
With the Actors deployed and running, you can now generate traffic for metrics to exist and therefore be seen in the Grafana Dashboard.
- Create a load generator that will populate the panels that are within the dashboard.
if [ "$(kubectl get pod benchmark-client -n "$OBS_NAMESPACE" \
    -o jsonpath='{.status.phase}' 2>/dev/null)" != "Running" ]; then
  kubectl delete pod benchmark-client -n "$OBS_NAMESPACE" --ignore-not-found
  kubectl run benchmark-client \
    -n "$OBS_NAMESPACE" \
    --image=curlimages/curl:8.10.1 \
    --restart=Never \
    --command -- sleep 86400
  kubectl wait --for=condition=Ready pod/benchmark-client \
    -n "$OBS_NAMESPACE" --timeout=2m
fi
You can optionally look at the load within the terminal:
bash <<'BASH'
# Do not enable `set -e`: expected command failures are handled explicitly.
set -u

: "${OBS_RESULTS_FILE:?run the Step 4 export block first}"
: "${OBS_DURATION_SECONDS:?run the Step 4 export block first}"
: "${ACTOR_COUNT:?run the Step 4 export block first}"
: "${OBS_ACTOR_PREFIX:?run the Step 4 export block first}"
: "${OBS_ATESPACE:?run the Step 4 export block first}"
: "${OBS_NAMESPACE:?run the Step 4 export block first}"
: "${SUBSTRATE_ROUTER_URL:?run the Step 4 export block first}"

get_actor_status() {
  kubectl ate get actor "$1" --atespace "$OBS_ATESPACE" 2>/dev/null |
    awk 'NR == 2 { print $4 }'
}

ensure_suspended() {
  local actor=$1
  local actor_status
  local attempt

  for attempt in 1 2 3 4 5 6 7 8 9 10; do
    actor_status=$(get_actor_status "$actor")
    if [ "$actor_status" = "STATUS_SUSPENDED" ]; then
      return 0
    fi
    if [ "$actor_status" = "STATUS_CRASHED" ]; then
      printf 'ERROR: %s is CRASHED and cannot be measured\n' "$actor" >&2
      return 1
    fi

    kubectl ate suspend actor "$actor" \
      --atespace "$OBS_ATESPACE" >/dev/null 2>&1 || true
    sleep 3
  done

  actor_status=$(get_actor_status "$actor")
  printf 'ERROR: %s did not reach STATUS_SUSPENDED (status=%s)\n' \
    "$actor" "${actor_status:-unknown}" >&2
  return 1
}

printf 'round\tactor\twake_seconds\n' > "$OBS_RESULTS_FILE"

deadline=$((SECONDS + OBS_DURATION_SECONDS))
round=0
successful_wakes=0
failed_wakes=0

while (( SECONDS < deadline )); do
  round=$((round + 1))

  for i in $(seq 1 "$ACTOR_COUNT"); do
    if (( SECONDS >= deadline )); then
      break
    fi

    actor=$(printf '%s-%03d' "$OBS_ACTOR_PREFIX" "$i")
    actor_host="${actor}.${OBS_ATESPACE}.actors.resources.substrate.ate.dev"

    if ! ensure_suspended "$actor"; then
      exit 1
    fi

    if wake_seconds=$(kubectl exec \
      -n "$OBS_NAMESPACE" benchmark-client -- \
      curl -sS --fail-with-body --max-time 60 -o /dev/null -w '%{time_total}' \
      -X POST \
      -H "Host: ${actor_host}" \
      "$SUBSTRATE_ROUTER_URL"); then
      printf '%s\t%s\t%s\n' \
        "$round" "$actor" "$wake_seconds" | tee -a "$OBS_RESULTS_FILE"
      successful_wakes=$((successful_wakes + 1))
    else
      printf '%s\t%s\tFAILED\n' \
        "$round" "$actor" | tee -a "$OBS_RESULTS_FILE"
      failed_wakes=$((failed_wakes + 1))
      sleep 16
    fi

    if ! ensure_suspended "$actor"; then
      printf 'Aborting to prevent a warm request from entering the wake results.\n' >&2
      exit 1
    fi
  done
done

printf 'successful_wakes=%d\nfailed_wakes=%d\n' \
  "$successful_wakes" "$failed_wakes"
BASH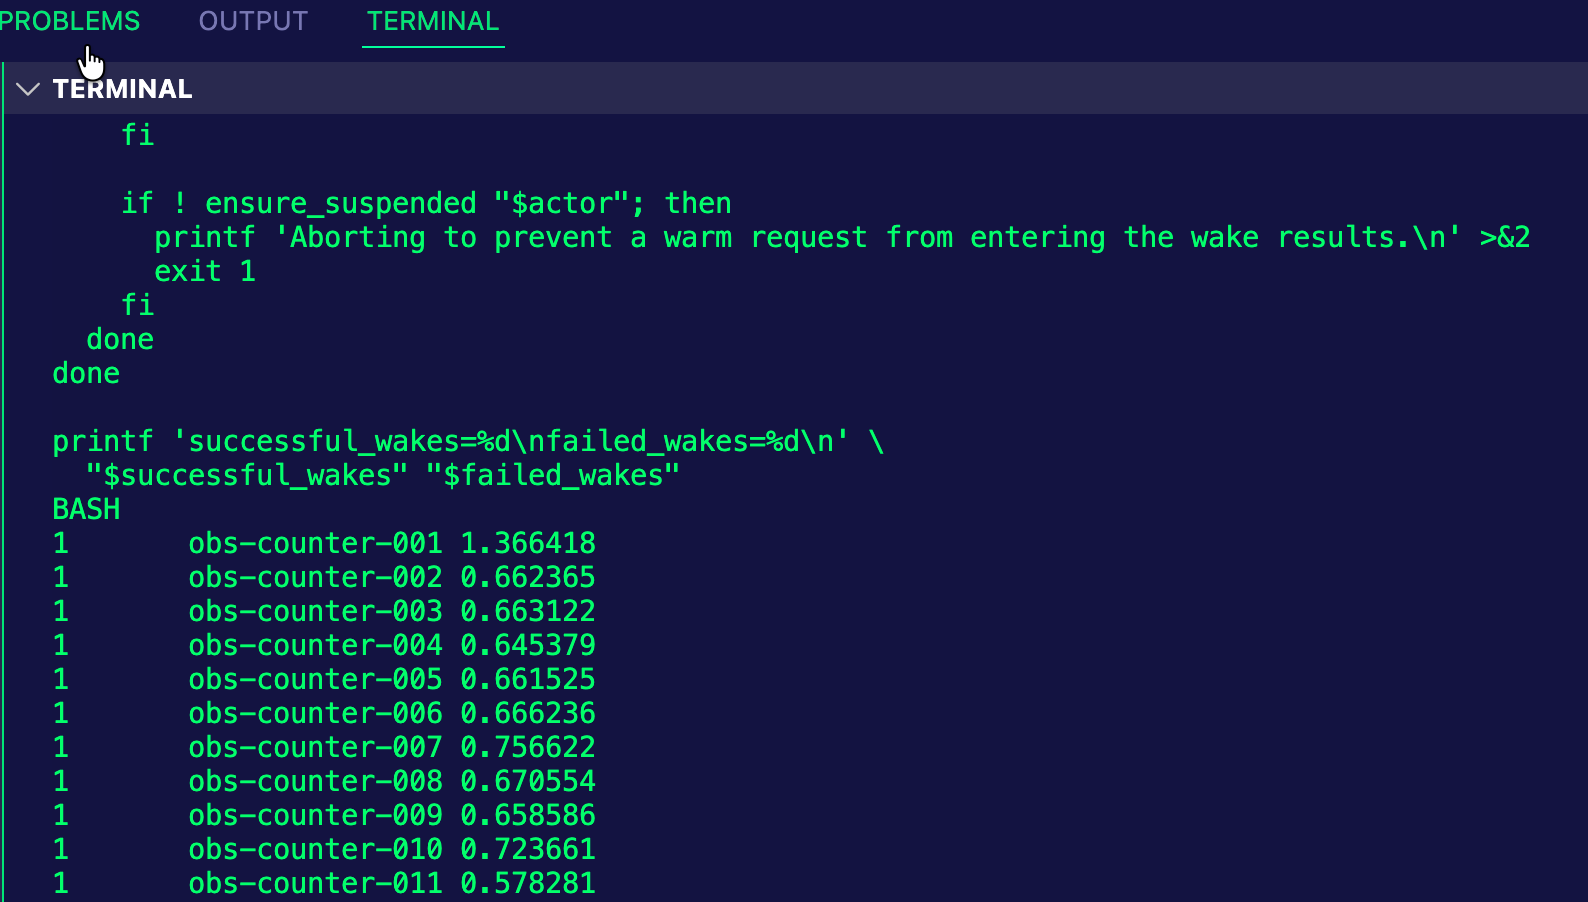
You can now see load generated within your environment.
Wrapping Up
Understanding how your Agents work, react, and respond at the lowest level matters. Looking at Agents from a high level means you never really, truly understand what's going on within your environment until it bubbles up to the top. Seeing how Agent Substrate Actors resume, start, work, flow, and respond will allow you to have a deep understanding of how your agentic workflows operate.

Comments ()